May 2021, Vol. 248, No. 5
Features
Annual US Natural Gas Production Decreased by 1% in 2020
By Energy Information Administration (EIA)
U.S. natural gas production – as measured by gross withdrawals – averaged 111.2 Bcf/d (3.15 Bcm/d) in 2020, down 900 MMcf/d (25 MMcm/d) from 2019 as result of a decline in drilling activity related to low natural gas and oil prices in 2020.
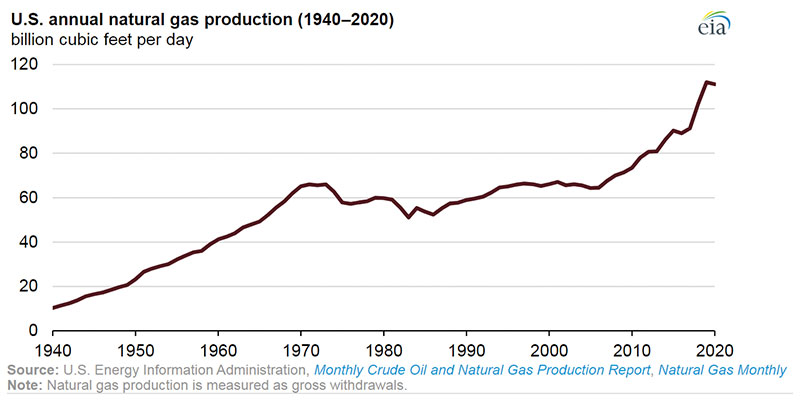
The 2019 record-high increase in natural gas production led to higher volumes of natural gas in storage and lower natural gas prices. Beginning in March 2020, warmer-than-average weather along with the effects of the responses to COVID-19 drove down natural gas demand and further reduced prices.
The lowest average monthly U.S. natural gas production volume was in May 2020 at 106.4 Bcf/d (3.01 Bcm/d). By December 2020, natural gas production had increased to 113 Bcf/d (3.2 Bcf/d).
The Appalachia region remains the largest natural gas producing region in the United States. Natural gas production from the Marcellus and Utica/Point Pleasant shales of Ohio, West Virginia and Pennsylvania continue to grow despite low regional natural gas spot prices.
Natural gas production from these three states increased from 32.1 Bcf/d (909 MMcm/d) in 2019 to 33.6 Bcf/d (952 MMcm/d) in 2020. Within the Appalachia region, West Virginia had the largest increase in natural gas production, increasing by 1.2 Bcf/d (34 MMcm/d), or 20%, to reach 7.1 Bcf/d (201 MMcm/d). Natural gas production increased by 1 Bcf/d (28 MMcm/d) in Pennsylvania and decreased by 0.7 Bcf/d (20 MMcm/d) in Ohio.
In 2020, Oklahoma had the largest decrease in natural gas production, falling by 1.1 Bcf/d (31 MMcm/d), or 13%, to an annual average of 7.6 Bcf/d (215 MMcm/d). Texas remained the largest natural gas producing state, although natural gas production in the state decreased from 28.4 Bcf/d (804 MMcm/d) in 2019 to 28.1 Bcf/d (796 MMcm/d) in 2020.

Comments