
April 2022, Vol. 249, No. 4
Features
CPCM – An ILI Methodology to Assess the Effectiveness of CP
By Dennis Janda, Product Line Manager, Entegra LLP
The role of cathodic protection (CP) is to mitigate damaging corrosion from the surface of the structure being protected.
Sir Humphry Davy first described CP in a series of papers presented to the Royal Society in London in 1824 in regard to protecting the copper-clad hulls of British naval vessels. It has always been understood that direct current (DC) flowing to a structure is what causes it to become cathodic and thereby protected.
A.W. Peabody stated, “Where current flows from the environment onto the pipe, the pipe is cathodic and there is no corrosion... Objective is to force the entire structure surface exposed to the environment to collect current from the environment.”1
Peabody also stated, “Potential measurements are used most commonly as a criterion. ... The basis for this is that if current is flowing onto a structure, there must be a change in the potential of the structure ... because current flow causes a potential change.”2
If the current provides the primary means of protection, why have we as an industry always relied upon voltage readings to monitor our efforts? The answer is simply that it was the easiest way to do so in the absence of an effective method to accurately measure the protective current.
As Peabody stated in the paragraph above, current flowing onto a structure will change the structure’s voltage potential. It is quite straightforward to use a voltmeter and a copper/copper sulfate reference electrode to take a pipe-to-soil potential, but a great many factors must be considered to arrive at an accurate pipe-to-soil potential.
Many of these factors can be outside the control of the operator and accurate data can be difficult to collect. Today, there is an effective method to accurately measure that protective current – the inline CP current mapping (CPCM) tool.
Operation
The inline CPCM tool operates in many ways like any other inline inspection (ILI) tool. It is propelled through the pipeline by the flow of the pipeline product.
The CPCM tool contacts the inner pipe wall at a specified interval on the tool, measures and then records the voltage drop in the pipe wall caused by the flow of CP current that has been received by the pipeline and is traveling back to its source to complete the electrical circuit.
This measurement is recorded several hundred times per foot. Post-inspection the recorded data are downloaded, and proprietary software is used to convert the voltage drop data to current values using Ohm’s Law calculation.
These values are then plotted against pipeline footage for a detailed map of the current pickup, direction of flow and magnitude. Weld detectors and odometers on the tool make alignment with other inline or over-the-line inspections straightforward.
When DC current flows through any conductor, the resistance of that conductor creates voltage drop. If the resistance is known, the amount of current flow can be calculated by applying Ohm’s Law, which states that in a circuit, voltage is equal to resistance multiplied by the current.
CP personnel have been calculating current flow by measuring voltage drops for decades. This is just like reading current with a shunt or calibrated resistor – by measuring the voltage drop across a known resistance.
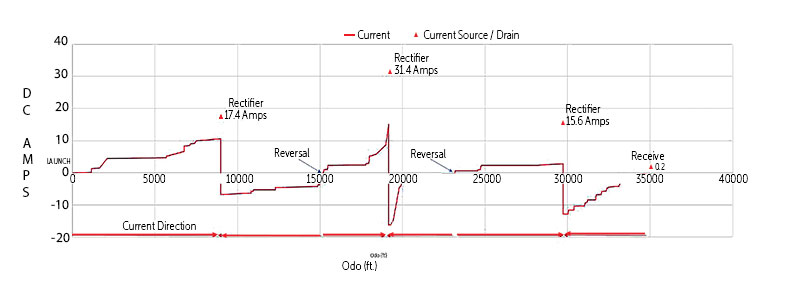
The CP tool uses the resistance of the pipe as the known value in this equation. Changes in pipe resistance due to wall thickness changes are accounted for in the current calculation. The resulting current plot is shown in Figure 1.
Integrity Fit
CPCM provides critical data for integrity plans by providing valuable CP information in areas that are usually skipped by traditional above-ground inspections. Areas like swamps and marshes, bodies of water, major river crossings, busy freeway crossings and areas under extensive pavement or concrete are often skipped by traditional inspection methods like close interval potential surveys (CIPS) or direct current voltage gradient (DCVG) surveys due to either cost or impracticality.
Areas such as this are quite often high-consequence areas and knowledge of CP effectiveness should be higher in these areas rather than lower. Figure 2 shows line current data from a river crossing that had acceptable potentials on each side of the river; however, an underground isolated flange and an undocumented bond to a bare water line were preventing current from protecting the river crossing.
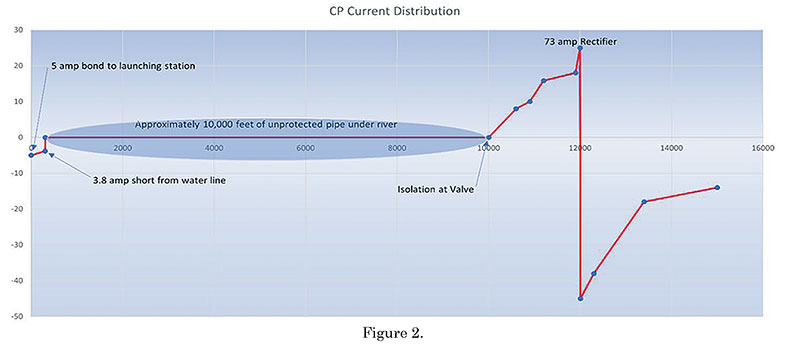
Pipe-to-soil potentials alone do not always tell the complete story and can, at times, lead to a false sense of security regarding protection levels on the pipeline.
CPCM data complement potential readings by providing a more complete overview of the CP system. When overlaying CPCM, metal loss and close interval survey data, the integrity personnel are better informed to make decisions regarding the overall protection and compliance of their pipeline.
CPCM Features
The CPCM tool identifies the following features – all of which are valuable in assessing the effectiveness of a pipeline CP system.
Pipeline Current: Measuring pipeline current is the primary function of the tool. It measures current direction and magnitude on every foot of the pipeline. All other features discussed in more detail below are based upon this function.
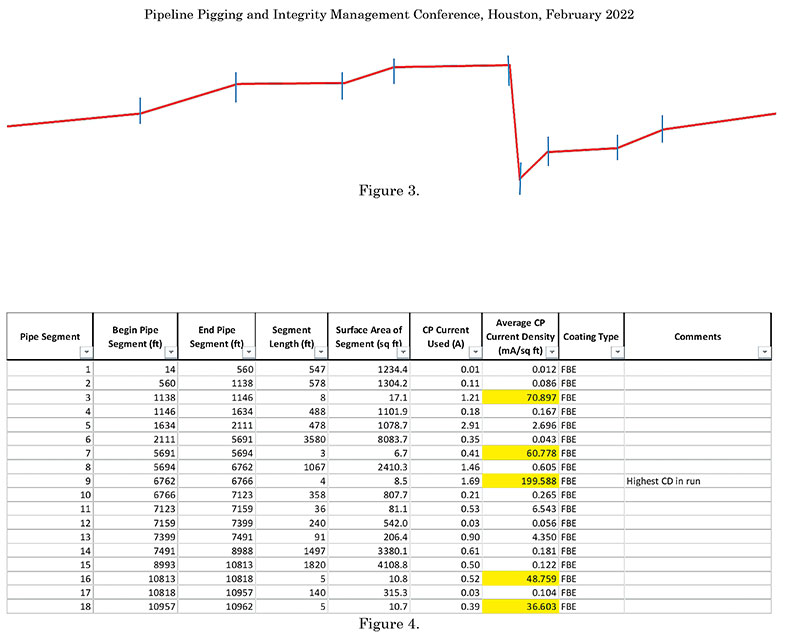
Current Density: This is calculated first by dividing the pipeline current plot into segments that exhibit linear current gain. At each change in slope, the graph is marked, then each segment is analyzed for length and amount of current pickup. The amount of current pickup from the soil is divided by the surface area and an average current density, expressed in milliamperes per square feet (mA/ft2), is calculated.
While these are average current densities for each segment, it is still valuable information that integrity personnel have not had available until now. Current density is very much related to coating quality. Areas with a steep current plot indicate high current pickup; therefore, poorer coating – areas with a flat slope – indicate low current pickup.
Low current pickup could simply be an indication of excellent coating, or it could be caused by insufficient current from the CP system (Figure 3).
These data are also given in a tabulated form in the final report. This makes it quite easy to see how the coating quality changes along the pipeline. It also provides definitive start and stop footages of each segment allowing for better budgeting if recoating the pipeline is considered, as shown in Figure 4.
Current Sources
The CPCM tool excels at locating all sources of current. This may seem overly redundant, but past inspections have found rectifiers that the operator did not know were connected to the pipeline being inspected and areas of pipe that did not have a rectifier connected at all or were connected to the wrong structure.
Current drains/bonds, shorts can be included together, as they are basically the same. The signature in the current plot looks the same. These would all be connections where current is flowing from a foreign structure (foreign pipeline, shorted casing, etc.) to the target pipeline through the bond or short rather than away from it.
This is especially helpful in identifying undocumented bonds – bonds/shorts of which the operator is not aware. With our industry’s reliance on instant-off potentials to meet compliance regulations, it is critical that every source and drain of current be accounted for in an effective interruption plan.
Not accounting for every bond can lead to misleading and inaccurate potentials. Three undocumented bonds to abandoned pipelines were discovered in a current mapping inspection (Figure 5).
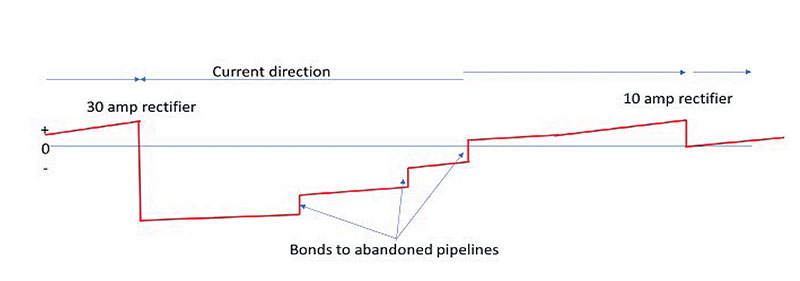
Not only are these undocumented bonds robbing the target pipeline of significant protective current, but they could also cause the pipeline operator to needlessly install additional CP systems to increase current to the target pipeline when the solution could be as simple as removing the undocumented bonds altogether.
Undocumented bonds/shorts can be overlooked easily during annual pipe-to-soil surveys and can even be missed during close interval surveys.
Midpoints, Rectifiers
In assessing pipeline CP systems, it is important to know the extent of coverage of each of the rectifiers protecting the pipeline. This is exceedingly difficult to ascertain using only pipe-to-soil potentials. However, this is quite simple when measuring the line current.
In John Morgan’s book, “Cathodic Protection,” he states that if two or more [rectifiers] are used on a pipeline, then there will be a point somewhere between these where the swing potential will be minimum and there will be no net flow of current in the pipe metal.3
He is describing the midpoint between two current sources. This point is simply where the overall current plot reverses polarity between the two current sources or, in other words, where the current plot crosses zero amps (Figure 6).
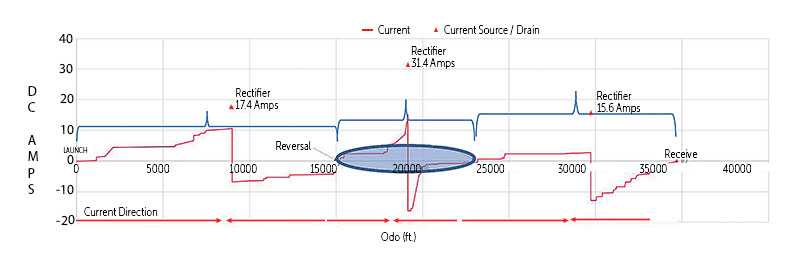
Most corrosion personnel would assume that the rectifier providing the most current would protect the most footage on the pipeline, but the largest output rectifier on this pipeline (31.4 amps) covers the least amount of pipeline footage – only 8,000 feet (2,438 meters).
Void Areas
Areas along the pipeline that do not indicate any current pickup from the soil or any flow along the pipeline are described as current voids. These are the result of either near-perfect coating that does not require much current or simply the lack of sufficient current to reach this point.
Operators are much more concerned about the latter condition, which indicates a lack of CP. Figure 7 shows such a condition. Areas like this are called out in the final data report after a current mapping inspection.
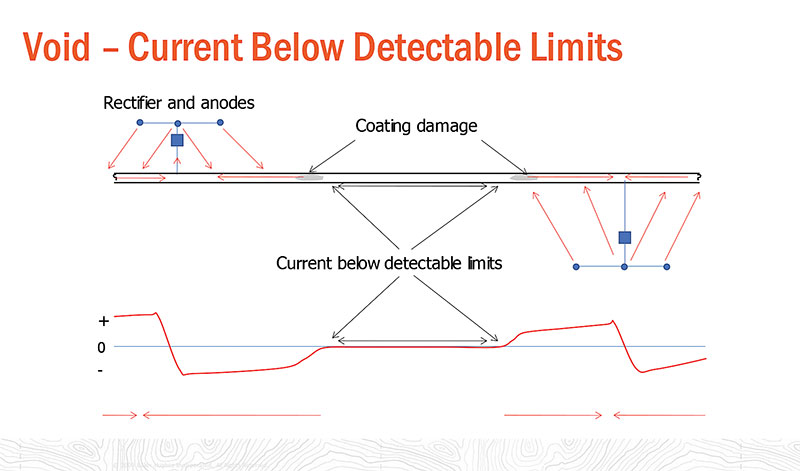
In this example, there simply is not sufficient current output from either the upstream or downstream rectifier to polarize the areas of coating damage (indicated on the graph by sharp rises in the current plot) and to allow current to move past these areas to protect the midpoint area.
Induced Alternating Current
Induced alternating current (AC) is becoming an ever-increasing threat to pipeline integrity as clear, open rights-of-way become less available and as our pipeline coatings systems get better and better.
Coupons to monitor the amount of induced AC on pipelines are often used in suspect areas but these are merely spot checks. They cannot give a full picture of induced AC conditions along the entire pipeline.
While the CPCM tool is primarily collecting DC data, it also has an AC channel that continuously measures and records the AC voltage drops in the pipe wall as well.
These voltage drops are not converted to AC currents but are graphed for the entire length of the pipeline, to give an indication of where AC may be threatening the pipeline. These threats can occur in areas that are not covered by AC monitoring coupons. Figure 8 shows an example of the AC voltage drops plotted.

Data Correlation
Because of the linear nature of CPCM data, it can be integrated with other integrity datasets, such as magnetic flux leakage (MFL) data and above-ground close potential surveys. This is where the real value of this technology lies to the integrity professional.
Overlaying CP current data with results from a recent MFL inspection can help integrity personnel start to understand why corrosion is occurring in certain areas (Figure 9).
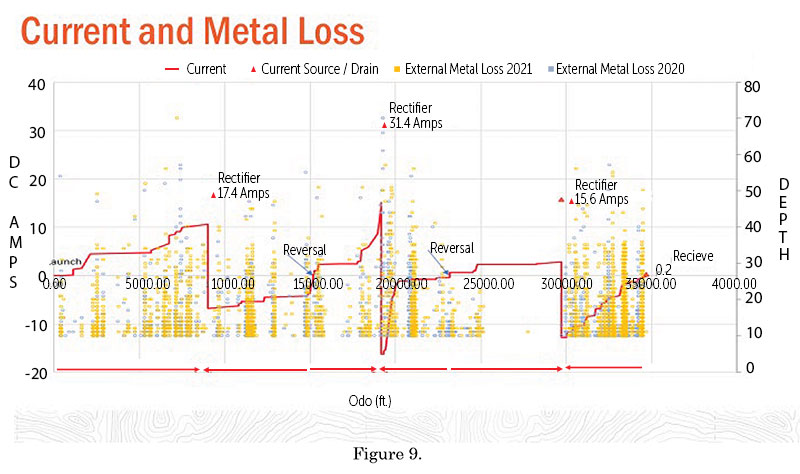
The goal of a CPCM inspection is not only to see and understand the relationship between the pipeline and its CP system, but it is also to reveal deficiencies in the CP system to allow integrity personnel to proactively address these deficiencies before corrosion damage occurs.
Areas with significant growth are not in areas with high current density. They are in areas of low current density, indicating that perhaps the corrosion mechanism is corrosion under disbonded and shielding coating.
Conclusion
CPCM provides a unique high-resolution method of assessing the effectiveness of a pipeline’s CP system. It provides critical data that conventional methods may often miss. It also provides the best end-to-end current density information available in the industry, thereby providing integrity personnel with trustworthy information regarding the coating system and how and where it may be degraded.
It excels at locating and quantifying undocumented bonds or shorts giving corrosion personnel confidence that they have accounted for and are interrupting every current source and drain connected to the pipeline during their interrupted potential survey.
CPCM is a new way of using an old measurement technique, providing valuable integrity information that has generally been unavailable to integrity personnel.
References:
- Peabody, A.W., Control of Pipeline Corrosion (Houston, TX: NACE, 1967), p. 19.
- Peabody, A.W., Principles of Cathodic Protection NACE Basic Corrosion (Houston, TX: NACE, 1980), pp. 5-2, 5-6, 5-11.
- Morgan, J., Cathodic Protection, 2nd Edition (Houston, TX: NACE, 1993), p. 204.
Editor’s note: Presented at the 34th Pipeline Pigging & Integrity Management Conference, Jan. 31- Feb. 4, 2022. © Clarion Technical Conferences and Great Southern Press. Used with permission.

Comments