August 2022, Vol. 249, No. 8
Features
Case Study: Improved Efficiency of Integrity Programs Using EMAT Technology
By Stephan Tappert, Jörg Weislogel, Ian Mullin and Korwin Moores, Baker Hughes
(P&GJ) — Various inline inspection (ILI) tools exist for different line operating conditions and defect morphologies. To address these varying conditions and morphologies, operators often need to run multiple ILI tools receiving results in separate or combined reports.
The additional data can supplement the primary data acquisition type for the targeted defect morphologies for the purpose of a more efficient integrity program via higher performance in the critical areas of defect detection, sizing, and discrimination.
Other data, such as geometry and corrosion data can be complementary for a more holistic pipeline integrity assessment. A self-contained ILI can help pipeline operators minimize operational disruption. Moreover, it can provide the accurate and reliable performance required for running an efficient integrity program.
Managing the threat of different crack morphologies in gas pipelines continues to be a focus for pipeline operators. PII Pipeline Solutions (formerly part of GE, now Baker Hughes) introduced its first EMAT ILI in 2002 [1].
This EMAT technique does not require a liquid couplant for the transmission of an ultrasonic signal into the pipe wall and, therefore, is suitable for use in gas pipelines. Initial operational experience using the first generation of EMAT technology uncovered limitations in the tool design [2, 3].
Some of the identified limitations led to tool developments and the release of the second-generation EMAT ILI. However, there was some fundamental & challenging work required to achieve the benchmarks set out by conventional ultrasonic crack detection technology run with liquid couplants.
The third-generation design (“Gen III”) was launched in 2008, with the key objectives to maintain and improve probability of detection (POD) and improve and ensure reliable Probability of Identification (POI) [4, 5]. The maiden inspection of this advanced EMAT Gen III demonstrated an 80% POI for features reported as cracks, a great leap forward in discrimination over previous generations.
The ability of GEN III to classify a targeted feature of interest with high confidence underneath a highway as a non-injurious feature was the first case study of improved efficiency for an integrity program using the EMAT technology. The targeted feature was previously detected by an ILI tool with lower classification certainty and as such did not provide the confidence needed for such a potentially impactful and costly remediation program.
Since then, has EMAT GEN III inspected more than 200 pipelines, totaling about 12,425 miles (20,000 km).
This article summarizes another case study on the topic of improved efficiency of a customer integrity program by ILI screening of specific crack feature types and targeting the minimization of cost through eliminating unnecessary excavations.
EMAT Operating Principle
EMAT (Electro Magnetic Acoustic Transducer) was introduced to the inline inspection industry at the beginning of the 21st century, to address the increased need of gas operators to find an alternative to hydrotesting. The inspection technology can also operate in liquid lines and presents the opportunity to complement conventional ultrasonic ILI technologies currently utilized to detect linear indications in liquid pipelines.
The EMAT technology is based on the phenomenon that an alternating current in a wire induces an eddy current in the metal surface. When a specific electric current and coil configuration is combined with a static magnetic field, a force is produced that causes the steel to oscillate, creating a guided ultrasonic wave in the pipe wall (Figure 1).
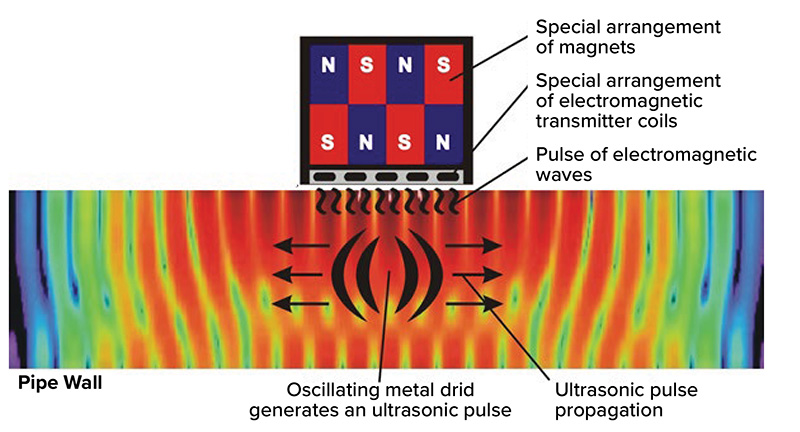
Features within the pipe wall will result in reflections of that ultrasound wave signal. These reflected signals are detected and recorded by EMAT sensors as electromagnetic signals. The signal characteristics and its time of acquisition when combined with that of other sensors, provides information about a given feature’s size, depth and location.
The Baker Hughes EMAT tool uses a combination of different ultrasonic wave types for feature detection, discrimination and sizing. The different wave types generate complex and unique wave forms which react differently to the same feature in the pipe wall.
This provides the data analysis process with the opportunity to distinguish between different feature types. The classification of features is not only limited to reflected pulse echo (PE) signals but can include the assessment of through transmission (TT) signals to provide further information for classification (Figure 2).
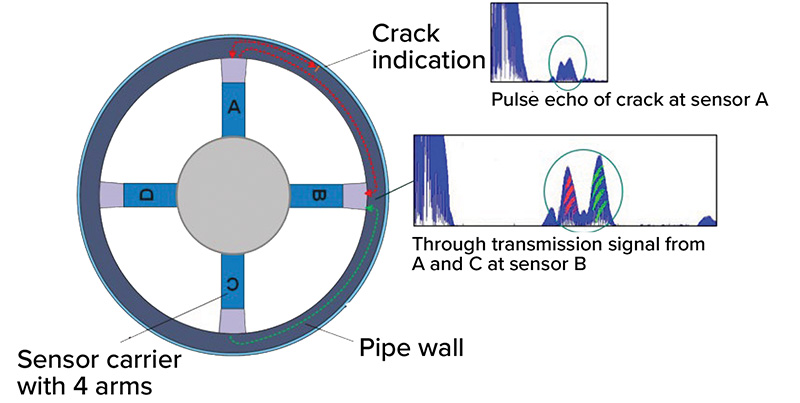
A high sensor efficiency allows a wide sensor spacing of 90° on a sensor carrier which is considered a long-range inspection technique. This prevents signal cross talk events and desensitizes the system to sensor lift-off by pipe out-of-roundness imperfections, such as dents.
The 1980s and 1990s saw the emergence of stress corrosion cracking (SCC) being identified as a key to pipeline integrity in gas pipelines and created a subsequent need for a reliable crack detection ILI tool suitable for use in gas.
EMAT was pursued by Baker Hughes as the most suitable method but the application of the technique to the long distance, harsh operating environment of pipelines was a long and formidable journey.
Since those early days, the EMAT technology has evolved and is established and the solution of choice for effective SCC management [6].
Collaboration between pipeline operators and service companies is key to advancing and realizing the true performance of the technology. The operator’s requirements of pipeline characteristics and accuracy required with respect to certain defect types are considerations in the selection of the ILI tool and service provider (Figure 3).

Tool performance experience, verification and validation work within a line section will reveal in some cases the necessity of detailed investigation and testing to support the tool selection decision or to further improve the efficiency of a planned integrity program. Data from a full-scale test on real or artificial anomalies may be used for qualification as part of pull testing [7].
Feasibility Study
In this case study, the customer was looking for an in-line inspection method to manage the integrity of a SCC susceptible pipeline system. Their experience using alternate technology had resulted in an inefficient maintenance program due to poor POI performance. Benign shallow defects, mainly consisting of external corrosion, manufacturing and construction features, were incorrectly identified as SCC (false positive) as well as being oversized in depth. This caused an unacceptably high number of unnecessary digs.
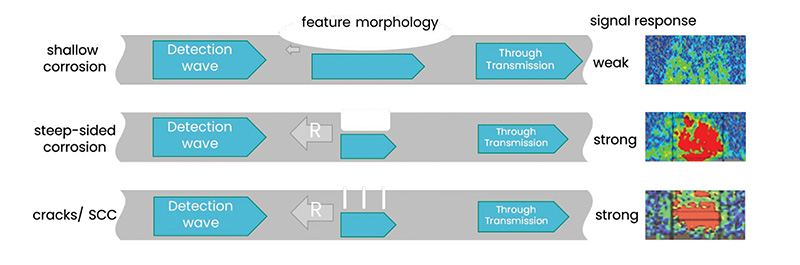
The Baker Hughes EmatScan Crack Detection (CD) tool is designed specifically to detect small, narrow cracks and SCC. Infield experiences indicate that shallow corrosion and other volumetric indications typically produce a weak (or no) signal response and are effectively filtered off by the measurement system and data analysis process.
A subset of such features with steep/sharp sided axially oriented geometry may be detected and pose additional challenges for discrimination against cracks. However, the sizing of any such corrosion features that are not filtered off or discriminated is not expected to result in over-sizing (Figure 4).
This performance expectation was the baseline and motivation for a feasibility study to demonstrate that the challenges and previous false calls experienced by the operator could be confidently removed. The objective of the test being to benchmark the detection and identification performance on similar features that would be expected by the customer prior to running the tool in the target pipeline and therefore safeguarding the chance of additional costly unnecessary digs.
Generally, the industry utilizes a combination of ILI technologies for volumetric indications. The goal was to demonstrate that the same result could be achieved with a single EMAT inspection.
Pull Test Program
The purpose of the test program was to collect data from four customer-provided pipe joints, using the BH EmatScan CD ILI tool to:
- validate crack and SCC detection, discrimination, and sizing performance.
- confirm that corrosion features are either not reported (as non-target features) or, if incorrectly classified, are not oversized in depth.
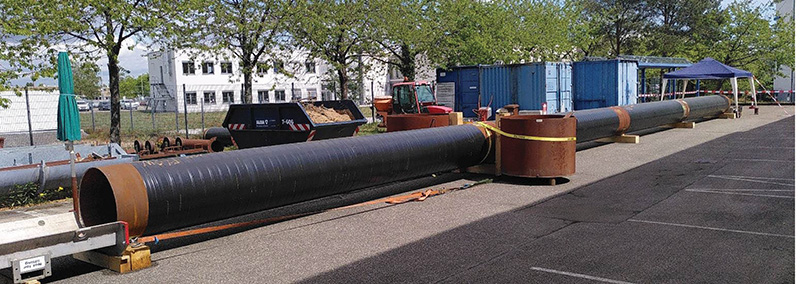
The pipe joints were covered on the external surface with tape coating to mask all features to conduct the data assessment as a blind test (Figure 5).
The data was collected at speeds of 1 and 2 m/s, respectively, and analyzed following the standard analysis process.
The success of the results was defined by the following pass/fail criteria:
- depth sizing accuracy on any crack or SCC feature with the tool sizing tolerance at ±1.1 mm for features <= 5mm depth, including field measurement error and confidence interval.
- depth sizing accuracy on any corrosion if detected and incorrectly classified as a crack/SCC feature at +1.1 mm / -100%, including field measurement error and confidence interval
- (depth tolerance of -100% indicates, it is acceptable if this defect is undersized or missing).
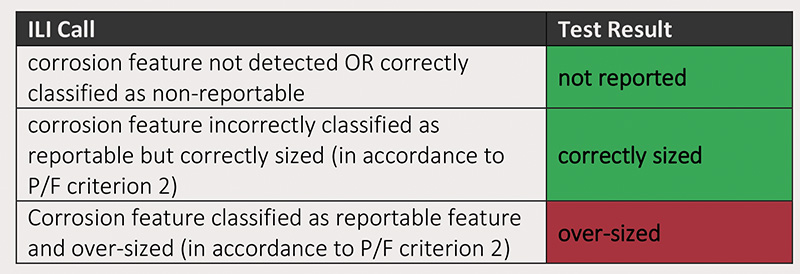
- overall performance on corrosion and metal loss feature handling (defined by the metric shown in Table 1) is to meet or exceed a POI specification of 80%.
The ′Σcorrosion features’ count does not include those coincident with crack/SCC features which would be considered as true positives:
Test Result
Reportable/non-reportable represents whether a feature would be included in a standard analysis report, e.g. classifications such as “crack-like.” “Crack field” would be reportable if sized at min reporting threshold. (Table 1)
Test Results
The data collected by the EmatScan CD tool was firstly evaluated within the data quality assessment (DQA) process and was confirmed to be suitable for analysis for both pull-throughs.
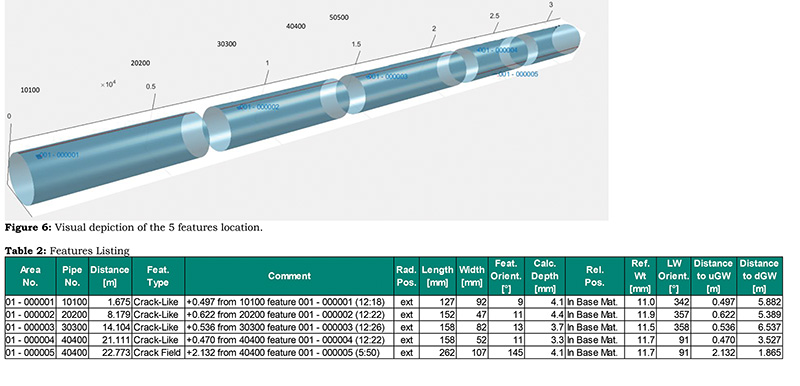
Subsequent preliminary data analysis identified a list of five detected features within tool specification of a minimum depth of 2 mm and a minimum length of 50 mm (Table 3).
The visual depiction of the feature locations (Figure 6), data screen shots of each defect (Figure 7) and comments on observed feature characteristics within the data supplemented the initial documentation of the results.
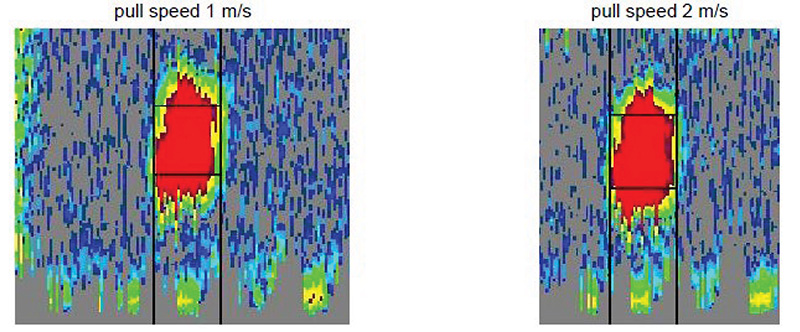
The data analysis was able to delineate the signal appearance within the EMAT data by characteristics such as the amplitude, number of sensors seeing the indication and the overall shape. Differences in signal characteristics resulted in feature classifications of two types: crack-like and crack field.
The dimension of the features was reported in a range from 3.3 mm to 4.4 mm in depth and from 127 mm to 262 mm in length.
Further detailed data analysis focused on expanding the feature listing by additional 29 features below the tool specification. The signal response of such features does not allow a decisive classification and/or sizing in all cases. Matching and comparison with the truth data for these features is, therefore, only conclusive for a subset. Once the preliminary and detailed analysis report was issued to the customer, the truth data was provided to assess the performance and evaluate it against the pass/fail criteria.
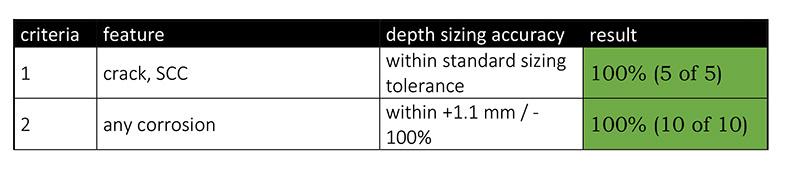
The five features reported as crack-like/crack field by the EmatScan CD system were verified to be correct. No unreported crack features within the specification of the tool were observed, hence the false negative (FN) rate was zero.
Some features within the EMAT data showed signal characteristics typically associated with corrosion/metal loss and were classified as such. For other features a decisive classification or sizing was not possible due to a lack of signal information, leading to a “not decidable” classification.
Both feature classification types of “metal loss” and “not decidable” are not part of standard final reporting but if reported, would not trigger an unnecessary excavation. The comparison with the nondestructive evaluation (NDE) results allowed data analysis to identify all features as either corrosion or below specification features.
Specifically, a sharp-edged corrosion feature with a depth slightly below the tool specification was correctly filtered off by the EMAT system. All 10 true corrosion features fulfilled the sizing accuracy criteria.
The overall performance on corrosion and metal loss reporting was based on a total of 10 corrosion features all correctly identified as non-reportable. A success rate of 100% was observed and therefore exceeded the minimum expectation of a POI of 80%.
Figure 8 depicts the effectiveness of the EmatScan CD system to filter off benign shallow defects, such as external corrosion, manufacturing and construction features.
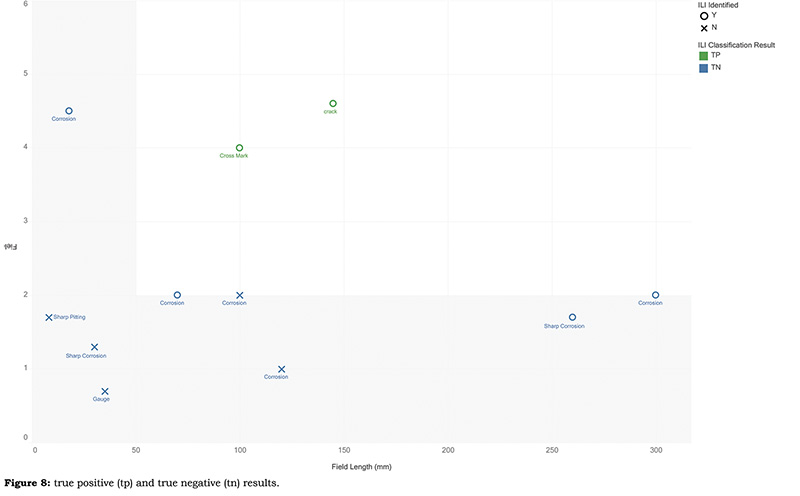
In summary, all target features were correctly detected and classified (True Positives, TP) and all non-target features (corrosion, sharp corrosion, sharp pitting, gouge) were correctly not reported (True Negatives, TN). This True Negative (TN) reporting performance will support the customer in preventing unnecessary excavations, enabling a more efficient integrity program focused on managing cracks and SCC threats.
Next Steps
The EmatScan CD tool is expected to improve the efficiency of the customer’s integrity program during the upcoming inline inspection campaign. The currently on-going modifications to the tool to comply with the line specific requirements are on track to meet the targeted run date.
Summary
The results of the EmatScan CD pull test program demonstrated the effectiveness of the in-line inspection system to filter off benign shallow defects, such as external corrosion, manufacturing and construction features.
This true negative (TN) reporting performance will support the customer in preventing unnecessary excavations, enabling a more efficient integrity program focused on managing cracks and SCC threats.
Acknowledgements: A version of this article was presented at the Pipeline Technology Conference 2022, Berlin.
References:
[1] Yeomans M., Ashworth B., Strohmeier U., Hugger A., Wolf T., “Development of 36” EmatScan™ Crack Detection (CD) Tool” International Pipeline Conference (IPC) 2002, Calgary
[2] Kothari M., Tappert S., Strohmeier U., Larios J., Ronsky D., “Validation of Emat In-Line Inspection Technology for SCC Management” IPC 2004, Calgary
[3] Van Boven G., Tappert S., Allen Lee D., Mann A., Balzer M., “Inline inspection for cracks in gas pipelines-Enhancements Derived from 5 Years’ Operational Experience” IPC 2008, Calgary
[4] Marr J., San Juan Riverol E., Tappert S., Mann A., Weislogel J., Jiangang S., “Validation of latest generation EMAT in-line inspection technology for SCC management” IPC 2010, Calgary
[5] Kania R., Marr J., Rosca G., Garth C., Sutherland J., Tappert S., Käshammer K., Mann A., “The role of effective collaboration in the advancement of EMAT inline inspection technology for pipeline integrity management: A case study” International Pipeline Conference 2012, Calgary
[6] TransCanada’s Global Pipeline Award Video https://vimeo.com/295838415
[7] API Standard 1163 3rd Edition, September 2021

Comments