February 2022, Vol. 249, No. 2
Features
Erosion Prediction, Prevention in Pipeline Gas Production
By Muthuramalingam Ganapathy, WS Engineering & Fabrication, Singapore, Harikrishnan Lakshminarayanan, Prashanth Sundarraj and Chandragupthan Bahubali, Wood India Engineering & Projects, Chennai, India
Oil and gas facilities handle multiphase fluids with sand or without sand. According to industrial experts, many causes for erosion include multiphase flow with sand or without sand, droplet impingement, slurry flow, cavitation and droplet flash.
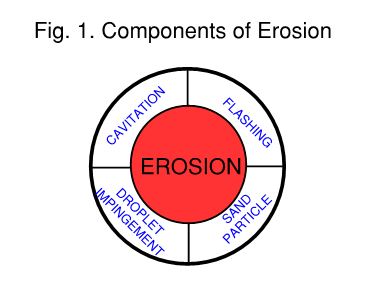
Droplet impingement (water droplet erosion/liquid impingement erosion) is usually encountered by the impact of high-speed water droplets in gas lines. Cavitation erosion occurs in liquid lines when the operating pressure of the fluid drops below the vapor pressure. Droplet flash is like cavitation with bubble collapse.
Sand production rate depends on many factors, such as reservoir depletion, an increase in water cut, higher drawdown (production rate), downhole screen, packing (gravel/coated gravel) failure, proppant entrainment and formation collapse.
Erosion Rate
Numerous factors and complex phenomena are involved in erosion. The particle shape, size, hardness, density, velocity, impact angle, impact level and wetness/dryness are key contributors to the erosion rate.
Factors such as continuous fluid phase/carrier fluid phase density, viscosity, and flow line hardness and thickness also have significant roles in erosion. Spherical-shaped particles will have lower penetration power than sharper/angular particles. Small sharp particles can be more erosive than large semi-rounded particles, and well-rounded particles cause four to five times less erosion than very angular particles.
However, if the particles are the same shape, the smaller sand particles cause lower erosion rates due to lower kinetic energy and lesser impact force to erode the surface. However, it is impractical to control the particle/sand shape. Higher concentrations of sand will collide with the wall of the pipe and with the sand particles, which will result in the lower impact velocity that slows down the erosion, called “shielding effect.”
There are few studies about temperature effects on erosion, and it is believed that temperature has limited impacts on erosion. Some studies show that impact energy is absorbed by plastic deformation of the material at higher temperatures, which results in a lower erosion rate because the material ductility increases. Particle impact angle plays a significant role in the erosion rate; however, it is impractical to control.
Major Indicators
Natural solids arise from reservoir minerals. Broadly, these are sand and silt, a terminology based on size and not chemical nature according to ISO 14688 and ASTM D2487 standards. For most sand, the average specific gravity (SG) varies from 1.8 to 3.0.
Although the average particle size varies from one well to another, even within the same formation, sand particles typically range from 50 to 150 µm. Silt has a smaller particle size and is usually present in lower concentrations. It contains clay, which has a very fine particle size (<10 µm), making gravity or enhanced gravity separation difficult.
Typically, clay particles will flow through the production system in the oil phase and are reported in the basic sediment and water (BS&W) analysis.
Predicting the rate of natural solids production is difficult because of changing well conditions and the challenges of obtaining in situ data from the reservoir. Particle shape will change the rate of erosion by an order of magnitude.
Well-rounded shape particles cause less erosion than angular or sharp particles by four to five times. In general, smaller particles cause lower erosion since they have relatively less kinetic energy and impact force to erode the surface.
Turbulence is one of these factors. The exchange of momentum between fluid and particle is more efficient for smaller particles, so they respond to fluctuations easily. Particle interaction also affects smaller particles more than larger particles. Particle impact velocity and kinetic energy per impact are dependent on particle size. Erosion rate is directly proportional to impact velocity.
Erosion rate a (impact velocity) N, where “N” is the empirical constant and depends on the hardness of the material and ranges from 0.3 to 4.5.
When the impacting particle is softer than the pipe material, then it may deform during the impact and its kinetic energy will not be transferred to the pipe material fully.
When particles rebound from the wall, they hit the particles that move toward the wall and slow them down. Therefore, depending on the fluid and geometry conditions, higher sand concentration may result in a lower erosion rate, which is often called “shielding effect.”
The rate of erosion is dependent on the velocity as well. In a high-velocity system, a small amount of sand can cause a significant amount of erosion. As a rule of thumb,
Erosion rate a (velocity) N, where “N” is the empirical constant and ranges from 2 to 3.
Hydrodynamics
In liquid-gas annular flow, particles may concentrate near the wall; droplets may encapsulate particles and cause them to impact on a small area. Upstream restrictions may concentrate particles into a jet that impacts the wall, resulting in erosion. Swirling flow may concentrate the particles into “spiraling ropes.”
There is some evidence that annular flow may effectively cushion particle impacts and reduce erosion rate in some scenarios. Drag forces in liquid and gas differ, which may result in a higher erosion rate in the case of gases compared to that of liquids operating at the same velocities.
Normally, oil wells produce more sand than gas wells and are equally prone to erosion. Fine solids (<10 to 30 µm) either flow through to the oil phase (forming BS&W) or report to the oil/water interface stabilizing the emulsion/rag layer.
Large solids (>100 µm) settle immediately in the production separator and can be removed by maintenance cleanout or with jetting equipment. Medium solids (25 to 100 µm) flow through in the water phase.
Erosion Prediction
Normally, single-phase liquid lines are sized based on the pressure drop and velocity criteria. To minimize the erosion, the pressure should be maintained in such a way that it is above the vapor pressure to avoid cavitation erosion and velocity to be more than 3 feet per second (1 meter per second) to minimize the deposition.
For sizing of single-phase gas lines, a pressure drop is the primary criteria, and velocity should be limited to avoid erosion of protective layers/stripping of corrosion inhibitor films. Flow lines, production manifolds, process headers, and lines transporting two-phase gas/liquid should be sized based on velocity criteria and flow regime.
The minimum velocity should be greater than 10 feet per second (3 meters per second) for two-phase flow to avoid slugging, particularly in long lines with elevation changes. On the other hand, extremely high-fluid velocities, presence of sand and corrosive contaminants may lead to erosion in the pipelines.
API RP 14E offers an empirical equation to predict the velocity above which erosion may occur:
Ve = C/Öρm
where Ve = erosional velocity in feet per second and C is empirical constant. For solid-free fluids, C = 100 for continuous service and C = 125 for intermittent service. For solid-free fluids of non-corrosive service, API RP 14E recommends a C factor of 150 to 200 for continuous service and up to 250 for intermittent service. API RP 14 E suggests that ρm can be calculated by using the following equation:
ρm=12409SlP+2.7RSgP/198.7P+RTZ
where ρm = gas/liquid mixture density in lb/ft3; Sl is liquid specific gravity at standard condition; Sg is gas specific gravity at standard condition; P is operating pressure in psia; T is operating temperature in Rankine scale; Z is compressibility factor; and R is gas/liquid ratio at standard condition.
API RP 14E considers only mixture density in its equation, and other factors listed above are not considered. API RP 14 E is applicable for two-phase (liquid and gas) equations, and it does not specify any C value for multiphase with solids.
NORSOK P-002 prescribes the follow equation to calculate the maximum velocity:
V = 183 x (1/ρm ) 0.5
where Ve = erosional velocity in meters per second and ρm = gas/liquid mixture density in kg/m3.
The recommended maximum velocity for liquids with large quantities of mud or silt is 13 feet per second (4 meters per second) for carbon steel (CS) and stainless steel (SS) lines. Similarly, for liquids with sand, NORSOK P-002 recommends the maximum velocity as 16 and 23 feet per second (5 and 7 meters per second) for CS and SS, respectively.
For non-corrosive well service and corrosion-resistant pipe material with a small amount of solid particles less than 30 milligrams sand/liter of mixed flow, the NORSOK P-002 standard restricts the velocity to 82 feet per second (25 meters per second).
For corrosive (flow-induced/erosion-corrosion) service where carbon steel piping is used, NORSOK P-002 restricts the velocity to 33 feet per second (10 meters per second) to preserve the protective coatings/films to reduce the risk for corrosion inhibitor film break down.
DNV GL-RP-O501 provides an empirical equation, which is the modified version of the equation developed by Finnie in 1960, to consider the effects of impact angle, particle velocity, geometry, particle size, concentration and piping components for quantitative assessment.
However, for a complex system/layout, DNV GL-RP-O501 suggests computational fluid dynamics (CFD) erosion simulations/test data to find the erosion rate and erosional velocity. As outlined in DNV GL-RP-O501, when increasing the bulk velocity from erosion class 1 (bulk velocity 0 to 16 feet per second [0 to 5 meters per second]) to erosion Class 3 (bulk velocity 33 to 66 feet per second [10 to 20 meters/second]), the expected erosion for a given sand load (kg) increases by a factor of 100 and similarly to erosion class 6 (bulk velocity of 164 to 230 feet per second [50 to 70 meters per second), the erosion potential increases by a factor of approximately 5,000.
DNV GL-RP-O501 empirical equations limit the particle concentration up to 500 ppmV (ppm given on a volume basis), particle diameter of 0.02 to 5 mm, the density of 2,000 to 3,000 kg/m3. It also outlined the other limitations such as maximum pipe internal diameter, physical properties of gas/liquids, the geometry of pipes, etc.
The erosion/corrosion research center at the University of Tulsa developed a series of semi-empirical models to estimate the erosion rate and safe operating velocity. The Tulsa model is widely accepted by industries, but flow regimes are not considered.
Industrial Data
Based on the operating experience and field data of gas-condensate fields in some offshore fields in the Middle East Asian countries, the velocity that could go up to 74 feet per second (23 meters per second) caused no unexpected erosion damage. Operators suggested the C factor of 170 as a safe value. Some of the operators in Europe are using a C factor of 300 as an upper limit for subsea water injectors completed with API L80 Cr tubing.
Gas wells with a minor quantity of entrained solids are being operated at a velocity about three times the API erosional velocity. In general, API erosional velocity is considered a conservative one. API RP 14E is not considering the sand particle parameters such as shape, density, velocity, impact velocity, impact angle, multiphase flow regimes, oil/water/condensate/gas physical properties, etc. However, it considers only mixture density of liquid and gas only.
Prevention
As outlined in DNV GL-RP-O501, various downhole sand screens (filters), oriented perforators, expandable sand screen, gravel pack, coated gravel pack, draw down control techniques, installation of inflow control devices and optimization of gas lift mechanisms such as gas lift or electric submersible pumps (ESP) in combination with choke operation are some of the common industrial practices for prevention of erosion.
Injection of lift gas increases the bulk velocity so that the erosion rate also increases, and the effect of gas expansion may result in a higher erosion rate. Choke valve material should be erosion-resistant when particle impact is expected.
In some cases, a certain length of choke valve outlet should be protected wear-resistant. Erosion of the choke due to particle recirculation may result in a higher erosion rate. To control erosion according to standard bridging theory, the dimension of a minimum passage should be at least three times the expected particle size.
Choke collapse due to brittle fracturing of erosion-resistant or trim scenario should be considered during the design. Proper design of the facilities will reduce the erosion risk.
Protection
Surface sand control techniques call for separators, filters, in-line de-sanders, wellhead de-sanders, cyclone separators and subsea cyclone separators with accumulators to separate sand/phase from the multiphase phase to reduce the erosion.
To reduce the erosive wear of choke trim components, operating the choke at less than typically 20% of the maximum choke capacity to prevent the reduced trim life is recommended. If the choke opening is typically 20% with sand production for a period of more than a year, temporarily installing a choke trim with reduced flow coefficient (Cv) should be considered. DNV GL-RP-O501 offers detailed guidelines for choke operation.
Maintenance and monitoring strategies will help to protect the downstream equipment from erosion.
Conclusion
Based on the reservoir data, production plan, enhanced recovery plan, solids (sand) characterization data, fluids (oil, condensate, gas and water) characterization data, proppant entrainment estimates, preventive techniques and completion data, erosion prediction analysis should be carried out for choke, flow lines, ESPs, subsea equipment, etc., with respect to production profile.
It is highly recommended to perform a detailed CFD analysis for erosion prediction. Multidiscipline cooperation and coordination are often required to develop a sustainable robust production plan.
References:
Managing sand Production and Erosion, DNVGL-RP-O501, August 2015.
Process System Design, NORSOK Standard P-002, August 2014.
Recommended Practice for Design and Installation of Offshore Production Platform Piping System, API-RP-14E.

Muthuramalingam Ganapathy works as a piping superintendent at WS Engineering & Fabrication (Singapore) Pte Ltd. He has more than 16 years of experience with oil and gas projects. He holds bachelor’s degree in mechanical engineering from Alagappa Chettiar College of Engineering and Technology, Madurai Kamaraj University, India.

Harikrishnan Lakshminarayanan works as a senior process engineer at Wood India Engineering & Projects Pvt. Ltd. (previously Amec Foster Wheeler India Private Limited). He has more than 10 years of experience in process engineering. He holds a master’s degree in chemical engineering from National University of Singapore (NUS, Singapore) and B. Tech (Hons.) in chemical engineering from SASTRA University, India.

Prashanth Sundarraj is a senior process engineer at Wood India Engineering & Projects Pvt. Ltd. He has more than 9 years of experience with oil and gas projects. He holds an undergraduate degree in petrochemical engineering from Anna University Tiruchirappalli, India. He also holds a post graduate diploma in process engineering.

Chandragupthan Bahubali is a senior principal process engineer at Wood India Engineering & Projects Pvt. Ltd. He has more than 18 years of post-graduate experience with oil and gas projects. He holds a master’s degree in refining and petrochemical engineering from University of Petroleum & Energy Studies and a bachelor’s degree in chemical engineering from Madras University, India.

Comments