January 2023, Vol. 250, No. 1
Features
Using Dynamic Simulation to Improve HPPT Level Control Performance
By Srini Kamandahalli, Ramsey J White and Ashiff Khan, Saudi Aramco, Saudi Arabia
(P&GJ) — The slug flow is a varying or irregular flow in the pipeline and surges of gas and liquid through any cross-section of a flowline. Slugs of liquid in multiphase lines can create serious design and operating problems for gas-oil separation plant (GOSP) processing equipment.
High liquid rates can rapidly fill up the separators and cause shutdowns due to high level trips, which will have an impact on separation efficiency, crude quality and produced water quality [1]. High gas rates can lead to compressors overloading and flaring. There are three basic mechanisms of slug formation, which are hydrodynamic slug, terrain induced slug and transient slug.
The hydrodynamic slug results when flow lines are operating in a stratified flow regime with density variations in the vertical direction. Terrain induced slugs are resulting from large elevation changes along the pipeline, they result from the build-up and dumping of liquids in each low spot in the line, and it is difficult to predict these slugs compared to hydrodynamic slugging. On the other hand, transient slugs occur when changes in flow conditions occur due to pipeline scrapping operations or changes in pipeline flow rates.
The inlet configuration of the subject facility consists of 14 trunk lines, which brings the multiphase wet crude from remote manifolds to the central facility. Each trunk line is connected to five production headers and these production headers feed multiphase wet crude to high-pressure production traps (HPPTs) where the initial three phase separation takes place, then the separated oil is further processed in the low-pressure production trap (LPPT), where two-phase separation occurs.
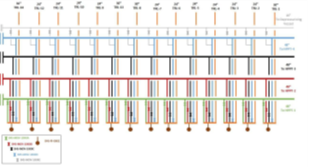
After that, it goes through the dehydrator and desalter and water oil separation vessel (WOSEP) for further processing to meet the required oil and water specifications. The below schematic diagram represents the trunk lines and production header arrangement in Fig. 1. Production rates are distributed from each trunk line through to each header via jump over lines with motor-operated valves (MOVs) set at different openings.
HPPTs receive well fluids from trunk lines via the inlet manifolds and separate all three phases of fluids: the crude oil, gas and water phases. The separated oil is further processed in the LPPT, where two-phase separation occurs. After that, it goes through the dehydrator and desalter and WOSEP for further processing to meet the specifications.
HPPTs are experiencing flow variability ever since beginning due to incoming slugs. The well-known reasons for slugs are generated in the trunk lines due to the hilly terrain of the production field.
The slug flow affects the levels in HPPT and hence the flow varies accordingly to the downstream equipment, which has a negative impact on crude quality and the produced water quality. These slugs are transferred to downstream equipment and processes, creating ripple effects in different unit operations.
l. Slug Measurement
Slugs can be identified when there is an increase in the ratio of liquid flow rate to total fluid flow rate into the first separator, and this is used as slug feature:
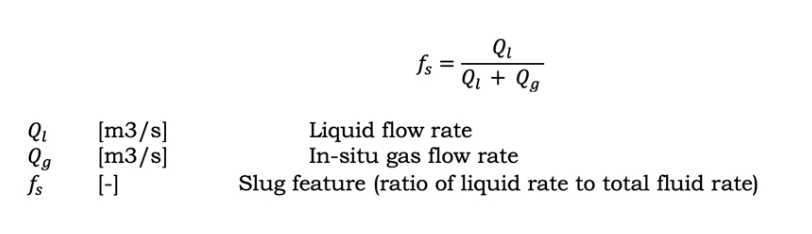
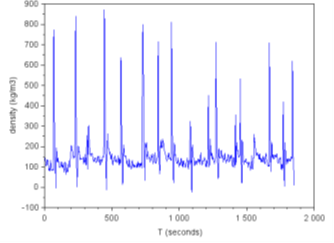
The slug measurement was carried out following the failure of HPPT internals in the year 2015-2016 [2]. Slugs in the piping is measured using two nucleonic densitometers (TRACERCO Diagnostics TM Pipeline Density Monitoring) at a known distance from each other. Density, as a function over time, is measured at both locations.
Density peaks (=slugs) are determined in each measurement and coupled. The time delay combined with the known distance gives the slug velocity.
The densitometers are clamp-on type and do not interfere with the process. The slug data from two locations show liquid slugs of (nearly) fullbore passing every 2-4 minutes for a brief period of 2-4 seconds followed by a near full gas (empty) flow in pipe for 1-2 seconds before regaining presumably about a 10-15% liquid of the pipe.
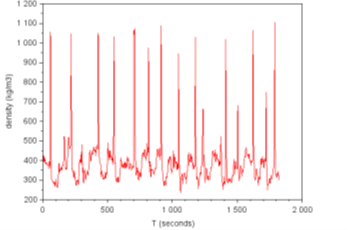
Figure 2 and Figure 3 show the results of the same run for the two density meters. Approximately every 150 seconds a slug occurs, but this is also dependent on the threshold one chooses. For instance, one could define the peak at 1250 seconds as a slug or not.
In addition to slug measurement and Finite element analysis (FEA) analysis were also conducted. The study results confirmed that slugs do occur every 2-4 minutes. The highest velocity slugs do occur only in 12% of the cases, thus about every 16-33 minutes. The controllers designed in HPPTs are not adequate to handle such level of slugs.
ll. DYNAMIC SIMULATION
HPPT dynamic simulation was developed by using HYSYS to simulate the field conditions. The model developed by using the various stream’s composition, pumps and control valve design data and current tuning parameter.
We first developed a steady-state model and then incorporated all controls in the model such as proportional integral derivative (PID) parameters, pump design data and control valves characteristic, then introduced inlet flow variations to HPPT in the model.
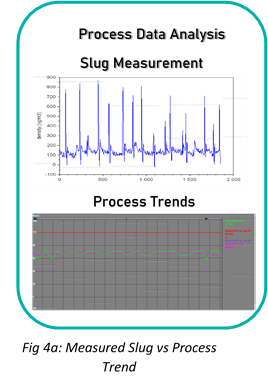
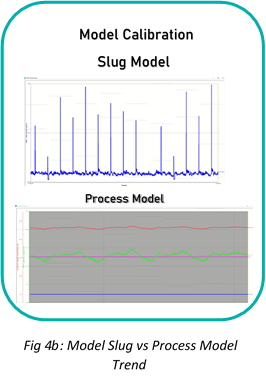
The model was calibrated to match field conditions by comparing with process trends and slug measurement trends, which was conducted at the facility. Figure 4a & 4B shows the results of dynamic simulation and process trends.
The flow chart describes the steps followed in the dynamic simulation development.
Control, Flow
The dynamic simulation trends below show that the control valve’s performance was observed during flow variations in the simulation and found that control valves required tuning.
The auto tuner function was used in the simulation to tune the control valves. After tuning, the level controls’ performance was found to be satisfactory with varying flow rates as well as frequent slugs to HPPT.
lll. HPPT LEVEL CONTROL MODIFICATIONS
Based on the observed performance in dynamic simulation, the following recommendations were developed for both interface and oil level control.
Currently, the oil-water interface level is controlled by using two control valves, LCV-100A, 4-inch size with level control valve (CV) of 80.7 and LCV-100B, 12-inch size with designed CV of 4237 both are manipulated by single controller LIC-100 with the same tuning parameter in a split range arrangement.
The issue with this kind of control scheme is, if the controller is tuned for the smaller valve to open quick enough to dampen the impact of an incoming slug, the larger valve will most definitely cause a surge into the WOSEP as it opens. On the other hand, if the controller is tuned less aggressive so that these surges do not occur, the controller will not be fast enough to handle incoming slugs causing significant increase in level.
The following are the recommendations made to overcome this issue.
- Change PID controller LIC-100 into two independent controllers LIC-100A&B and tune the level control valves LCV-100A/B by using independent PID tuning parameters instead of common PID parameters to have independent response time from each valve, this will greatly reduce the oscillations. LIC-100A modulates LCV-100A and LIC-100B modulates LCV-100B.
- The controller for the smaller valve would be tuned more aggressively and the controller for the large valve will be slower. This is expected to result in better level control and reduces level impact in WOSEP.
Oil Level Control:
Currently, the oil level is controlled by using two control valves, the LCV-200A is 14-inch size with CV of 5400 and LCV-200B is 20-inch size with CV 11588. Both control valves are manipulated by the single controller LIC-200 with the same tuning parameter in a split range arrangement. The issue with this kind of control scheme is, if the controller is tuned for the smaller valve to open quick enough to dampen the impact of an incoming slug, the larger valve will most definitely cause a surge into the LPPT as it opens.
On the other hand, if the controller is tuned less aggressive so that these surges do not occur, the controller will not be fast enough to handle incoming slugs causing significant increase in level. The following are the recommendations to overcome this issue.
The following are the recommendations made to overcome this issue:
- Change PID controller LIC-200 into two independent controllers LIC-200A/B and tune the level control valves LCV-211 A/B by using independent PID tuning parameters instead of common PID parameters to have independent response time form each valve, this will greatly reduce the oscillations. LIC-200A modulates LCV-200A and LIC-200B modulates LCV-200B.
- The controller for the smaller valve would be tuned more aggressively and the controller for the large valve will be slower. This is expected to result in better level control and reduces level impact in LPPT.
Level Settings
To accommodate slug volumes, recommended to change the HPPT normal liquid level (NLL) setting from current level 13-foot, 2-inch to 12-foot, 2 inch and high liquid level (HLL) from current 14-foot. 4-inch to 15-foot, 4-inch, which will increase the operating envelop and the level reaching to high set point is expected to be greatly minimized. This proposed level settings will increase the low-low liquid level (LLL) to HLL from 10.9 mins to 14.1 mins and increase the slug handling capacity from current 800 barrels to 2,150 barrels.
Below tables summarizes the existing and new level settings and residence time (filling time).
IV. RESULTS
Based on dynamic simulation results the recommendations outlined in section IV were implemented and the results shows improvement in interface level as well as improvement in oil levels and below process trends shows observed results. The HPPT levels were controlled in auto mode as compared to manual mode in the past. The variation in process were found to be improved which enhanced further with tuning of the controllers.
(Editor's Note: All charts and tables associated with this article are not present in the text. However, to view the complete article with all graphics click here.)
References:
[1] Oshinowo, Lanre M., and Regis D. Vilagines. "Modeling of oil–water separation efficiency in three-phase separators: Effect of emulsion rheology and droplet size distribution." Chemical engineering research and design 159 (2020): 278-290.
[2] Al-Abbasi, A. K., Al-Owaidhi, S. H., & Khan, A. (2018). HPPT restoration, redesign enhance integrity, efficiency at Saudi complex. Oil & Gas Journal, 116(5), 48-52

Comments