October 2015, Vol. 242, No. 10
Features
Risk-Based Design of Pipelines, Risers

The production and transportation of hydrocarbon products involves complex process systems with components that are exposed to extreme operational and environmental conditions. To ensure safe and continuous operation, it is important to identify probable risk sources and assess the integrity of the pipeline to avoid accidental or catastrophic failures.
A traditional integrity assessment can be a time-consuming, complex and expensive procedure for any pipeline or facility. However, incorporating a risk-based design is an alternative method to ensure a pipeline against time-dependent threats or risk sources, such as corrosion and cracks.
The probability of failures can be minimized or avoided by considering future risk sources in the early stage of the design. In this way, risk-based design ensures safe operation of a pipeline for the complete stipulated design lifecycle.
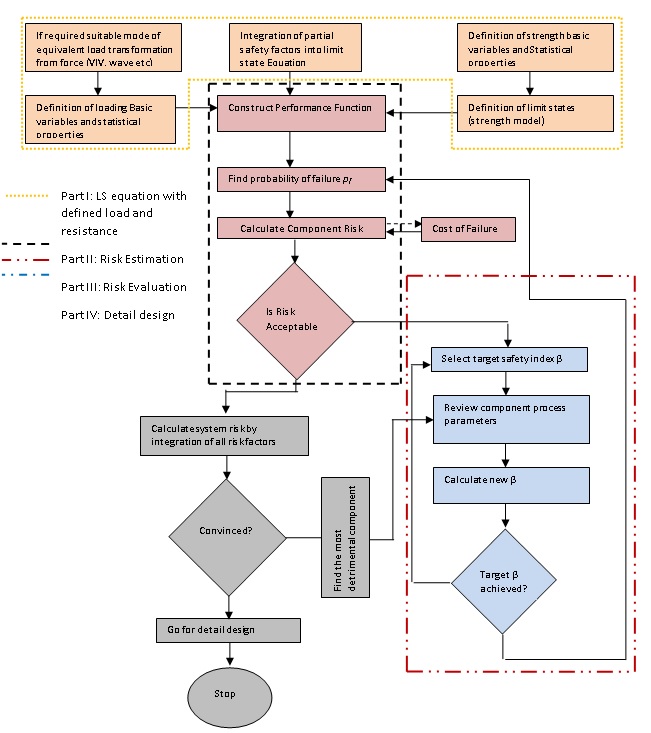
The risk-based design methodology (Figure 1) is divided into four parts:
Part I: Define Load, Resistance
The load and resistance of a pipeline may be defined considering limit state design (LSD) or load- and resistance-factored design (LRFD) (Figure 2). In LSD, the factored load and resistance are obtained by multiplying characteristic load and resistance values with safety factors. The class factor also may be considered to account for the severity of the consequences associated with the failure.
The class factor introduces the criticality to reduce the chance of damage to human life and the environment. LRFD is a semi-probabilistic approach in which the full probabilistic approach requires defining load and resistance in terms of distribution, mean and standard deviation.
Part II: Risk Estimation
Assessment of failure probability (Pf): The distribution of stresses, strains or any other kind of displacements in the pipeline should be determined from principles of statics, dynamics or kinematics. The selection of a performance model (elastic or plastic analysis) should be based on specified material properties and material behaviors.
The probability of failure is determined considering the load and resistance acting on the defected or cracked pipeline. It is believed defects or cracks will be created in the pipeline, assuming specific growth rate for different kind of corrosion within the stipulated design life.
Consequence analysis (Cf): The consequence analysis assesses severity of adverse effects of accident on people, property and the environment. Consequence analyses predict the magnitude of the effects resulting from release of toxic or flammable fluids and disruption of pipeline throughput.
Risk estimation: This involves combining the results of frequency and consequence analysis to produce a measure of risk. The risk associated with a pipeline failure can be expressed as:
where Pf is the failure probability, and Cf is a measure of the consequences of failure. A risk matrix as given (Figure 3) may be constructed based on the calculated failure probability and consequence of failure.
Part III: Component Risk Evaluation
Risk analysis provides the most consistent and rational basis for selecting target reliability levels, based on criteria such as economic optimization, safety and environmental protection. On the basis of probability of failure and consequence analyses, the target reliability level of pipeline can be selected either to meet a predetermined acceptable risk level or to optimize the total cost, considering the cost of failure.
If the estimated is not within acceptable risk limit (Figure 3), the pipeline parameters (D, t, corrosion susceptibility and ? for pipeline) may be revised to meet the target safety level.
Part IV: Detailed Design
Up to this point, the methodology calculates risk for a single mode of failure. Likewise, the risk for all modes of failure will be determined to calculate combined risk. Once the risks for all failure modes are evaluated, fault tree analysis (FTA) can be considered to calculate system risk. Thus, aggregated or unified risk can be minimized for individual components by achieving the target safety level of the system.
If the designer is not satisfied with the system risk overall, the next option is to review the process component parameters in order to identify the most detrimental risk components responsible for system risk. Once the higher risk/critical components are identified, design parameters can be modified to reduce. If the designer is satisfied with the revised overall risk, the next task is to move on for detailed design.
The risk-based design methodology is applicable for any pipeline design, both onshore and offshore, with careful consideration of local environmental condition, pipeline steel material, loading and operational condition.
The algorithm of risk-based design is taken from the framework developed in Figure 1.
Step1: Generate a random variable considering distribution and characteristics values with the required confidence level for both load and resistance.
Step 2: Construct the limit state such as for load and resistance and calculate the probability of failure. The mean and standard deviation will be calculated using first-order, second-moment method (FOSM), advanced first-order, second-moment method (AFOSM) or the second-order reliability method (SORM) method, whichever is applicable.
Step 3: For each defined failure mode/threat/risk source, apply the Monte Carlo simulation (alternate way of analytic approach, where analytic approach is not applicable or to validate the failure probability calculated by analytic approach) to calculate probability of failure based on probabilistic approach.
Step 4: Calculate risk exposure using the equation.
Step 5: If risk exposure is determined to be higher than acceptable or practicable, review design parameters of the component and recalculate the risk.
Step 6: Up to this step, this is a component design for a specific mode of failure. Now, likewise calculate all other modes of failure.
Step 7: Integrate the failure modes using fault tree analysis (FTA) with the necessary correlation between the failure modes. If there is no correlation, assume independent failure modes. Find a single probability of failure for a process system.
The correlation of failure modes can be difficult to assess. If that proves to be the case, use the worst-case probability as the standard for any group of threats/failure modes which perform or act against the system in a similar manner, is often used as the base case.
Step 8: If the resulting risk level is not acceptable, the designer must assess the most detrimental or high-risk failure modes and consider adjustment of the design parameters of the respective component. The same iterative procedure is, therefore, continued until the target safety/risk level is reached. At this stage, where the target is met, the specified design parameters should then be selected for final design and construction.
Considering the extreme consequences offshore, such as replacement cost, cleaning cost and integrity assessment cost, the quantitative risk-based design (RBD) approach ensures optimum design without compromising the safety of oil and gas pipelines and risers.
The conceptual model may be considered for other similar kinds of applications, such as risk-based inspection (RBI), probabilistic corrosion rate assessment, reliability-based wastage allowance determination and risk-based corrosion management for oil and gas pipelines and risers.
Authors: Sikder Mainul Hasan is an integrity specialist at Genesis involved in engineering criticality analysis or fitness for service assessment for offshore structures. He is also engaged in safety, integrity and reliability studies, and hazard workshops.
Jason Everett Hults is the Integrity Management Department manager at Genesis, specializing in identifying, managing and mitigating risk throughout complete project lifecycles in the energy sector. Binder Singh is principal integrity engineer at Genesis. His main areas of expertise are corrosion, materials performance and integrity management. He has over 30 years’ offshore/marine experience in the UK Marine/North Sea and the U.S. Gulf of Mexico.

Figure 2: Basic failure probability using LSD or LRFD.

Figure 3: Sample risk matrix

Hassan

Holts

Singh


Comments