August 2023, Vol. 250, No. 8
Features
Fatigue, Burst Tests Among Best Ways Assess Pipeline Welds
By A. Y. Dakhel, M. Gáspár, Zs. Koncsik and J. Lukács, Faculty Members, Mechanical Engineering and Informatics, University of Miskolc University
(P&GJ) — All over the world, the pipelines of large diameter and relatively thin wall thickness are used to transport hydrocarbons. These pipelines or piping systems are usually comprised of girth welded joints.
During the design stage, the structural integrity and fatigue resistance of these girth welded joints must be evaluated. Although there have been significant developments in the use of other welding processes for construction of girth welded pipelines (e.g., friction stir welding1,2, fusion welding) processes remain the most dominating process.
The periodic startup and shut-down events, the changes of internal pressure values and the external impacts result in cyclic loads, have a crucial effect on the life of both the pipelines and girth welds. Among the different piping systems, there are systems under low-cycle fatigue3, 4, high-cycle fatigue5, as well as under seismic6, 7 and dynamic8, 9 loading conditions.
Defects or discontinuities occurring in gas pipelines, either due to poor manufacture or unfavorable operating conditions, can lead to propagating cracks, and these pipeline cracks may cause catastrophic fractures.
There are several organizations who regularly publish statistical data and analyses about incidents and faults, distinguishing the girth weld defects (e.g., 10, 11). In addition, the various damages are analyzed one by one in order to identify the causes and prevent a subsequent damage.
The damaged areas of HUi (i = 1, 2, 3) failure cases (Figure 1).
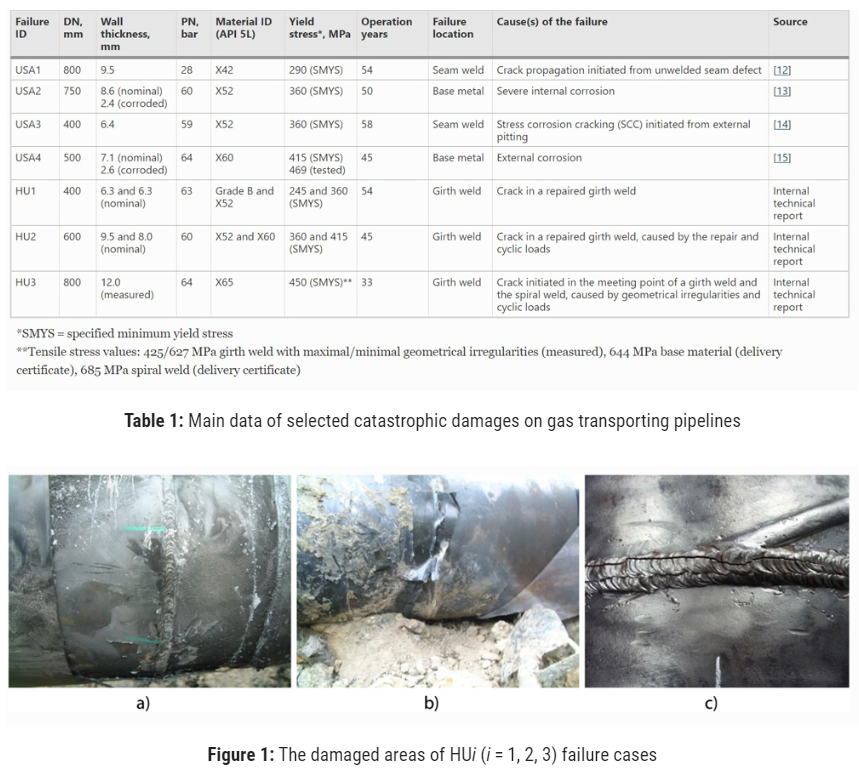
Damaged areas of girth welds on Hungarian pipelines: a) HU1: DN400, crack in a repaired girth weld; b) HU2: DN600, repair and cyclic loads caused crack in a repaired girth weld; c) HU3: DN800, geometrical irregularities and cyclic loads caused crack, initiated in the meeting point of a girth weld and spiral weld.
A previous analysis has shown that welds are more damageable, the construction defects and material discontinuities occurs in much higher ratio in welds than in the other parts of the pipelines16.
The comparison of the international data and the Hungarian statistics shows, on the one hand, that the ratio of the weld defects in Hungarian transporting pipelines is higher than in the international practice; on the other hand, the location of weld damages typically occur in girth welds.
The reason for this is that superimposed mechanical stresses (e.g., bending stresses) were often introduced into the system during the construction of the girth welds and the acceptance criteria (workmanship criteria) for the girth welds did not meet today’s requirements. All these together mean that the girth welds in the Hungarian natural gas transporting system can be considered as potentially hazardous places.
There are different possibilities and ways preventing catastrophic damages of pipeline girth welds, as follows:
- Developing of newer non-destructive testing methods in order to identify the girth weld defects in operating pipelines17,18,19
- Achieving FEM calculations in order to investigation of defect size tolerances in girth welds20, describing the damage process8, 9, or to preparation of fracture mechanical analyses21, 22
- Performing investigations on specimens in order to determine and analyze the tensile and toughness properties23, yield strength mismatch24, or fracture properties at low temperatures25 of girth welds; to develop novel test method for mechanical properties of characteristic zones of girth welds 26; to develop “field girth welding simulation” procedure evaluating properties in HAZ of girth welds 27; or to ensure the safe operation of a pipeline transporting environments with hydrogen content28
- Applying local approach to fracture in order to analyze of full-scale pipeline tests containing girth weld defects29
- Performing investigations on full-scale pipeline sections for describing the behavior of the pipelines under different loading conditions5, 30, 31, furthermore for the comparison of the results based on full-scale pipes and small-case specimens32
- Applying engineering critical assessment (ECA) methods33, 34 based on different standards35, 36
- Developing survival analysis models for girth weld failure prediction37
The full-scale test was played an intermediate role between numerical simulations and specimen tests.29 A full size test was carried out on a welded pipeline segment containing a girth weld defect; the pipe was subjected to internal pressure and superimposed bending.
The work shows that numerical simulation can be used to carefully analyze full-scale tests, Furthermore, the work shows too, that fracture material properties determined with small-scale specimens can be used to simulate cracking behavior of large-scale components using damage models.
Fatigue tests were performed under constant amplitude loading on both full-scale pipe sections and cut flat specimens from comparable pipes 32. Significant differences were found in their high-cycle fatigue behavior, the small-scale flat specimens showing more favorable fatigue properties.
The reasons were investigated with the relation of fatigue crack initiation location, weld geometry, type of pipe, loading conditions, residual stresses, and size effects. Conclusions were drawn about the suitability of flat fatigue test specimens for representing the fatigue behavior of full-scale girth welded pipes and the necessity for testing of full-scale pipes, too.
Marine risers make connections between the surface floating facilities and the subsea wells, basically with heavy duty girth welded tubular structures. Both dynamic and cyclic loads, as well as weld defects can cause damages in these connections. In order to investigate the fatigue performance of marine risers, a fatigue test system was designed and implemented5.
With a mathematical model developing for the calculation of natural frequencies, the fatigue performance of marine risers with different welded tubulars and connections were evaluated.
Considering the limitations of fatigue calculations, design against fatigue, and small-scale fatigue tests in the evaluation and analysis of pipeline integrity, the feasibility of submarine pipeline full-scale fatigue test technology was demonstrated in engineering applications30.
The full-scale test offer a quantitative basis for the subsequent full-scale fatigue life evaluation and the safety operation, and furthermore provide a reference direction for the future development of submarine pipeline full-scale fatigue test technology.
Full-scale fatigue and burst test are the best ways of assessing the crack propagation resistance of a natural gas pipeline, especially in cases of the girth welds. However, both the full-scale tests and the fatigue and burst tests are time-consuming and expensive. Although special test stations have been developed for such purposes (e.g., based on resonance method for steel catenary risers), these investigations are still not considered routine38.
The basic objective of the research work is to contribute to a safer operation of gas transmission pipelines. The direct research aim is to investigate the behavior of the girth welds and the reserves in the girth welds of operating pipelines, based on fatigue and burst tests carried out on experimental pipeline sections, replaced from operating gas transporting pipelines.
In order to make direct and indirect utilization of the test results, a safety factor was defined, and the main directions for further experimental work were identified.
2 Experimental Setup
2.1 Testing facilities
There are two computer controlled electro-hydraulic testing systems for pressure vessels and piping at the Institute of Materials Science and Technology, University of Miskolc.
One system can be used up to 100 bar and the other up to 700 bar internal pressure. A block diagram of the lower pressure system (Figure 2) and the higher pressure system (Figure 3). The logical structure of the two systems is identical. The regulation and the control of the pressure were implemented during the whole tests in a closed loop.
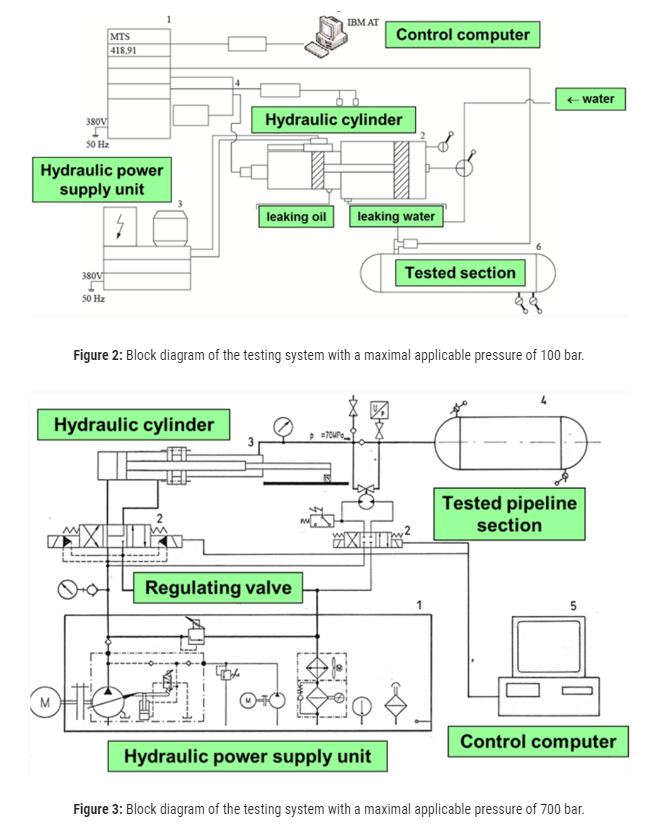
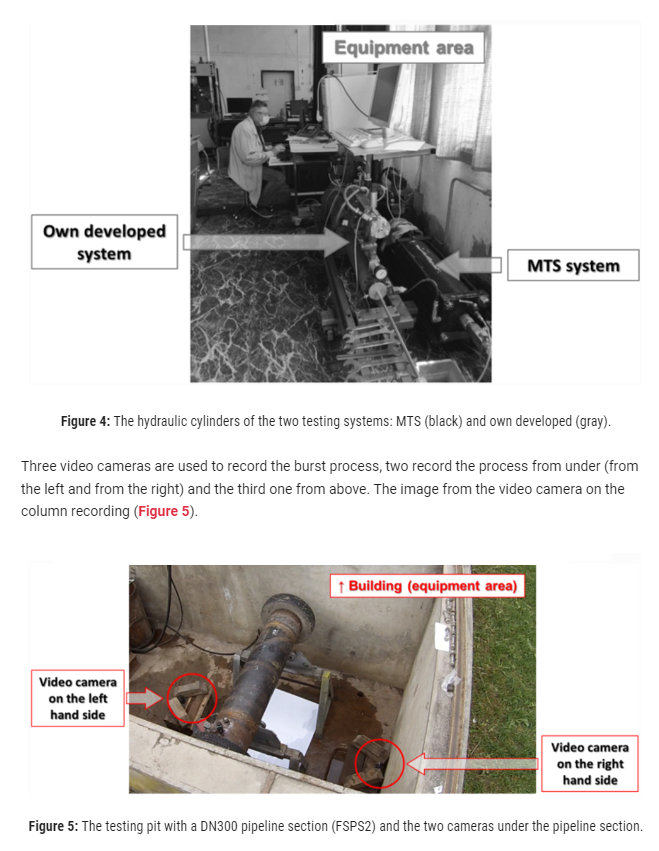
The tested pipe sections are located in a pit outside the laboratory building; all other components of the systems are located inside. Figure 4 shows the hydraulic cylinders of the two systems.
2.2 Investigated Pipeline Sections
Spiral welded (submerged arc welding) steel pipeline sections with girth welds were examined. The main parts, which are the middle parts, in other words the investigational parts of the girth welded pipeline sections, were cut from operating pipelines after long-term operation.
Table 2 summarizes the main particularities of the tested pipeline sections (FSPS = full-size pipeline section), the minimum and maximum internal pressure values (pmin and pmax), and the testing frequencies during the full-scale fatigue tests. The API 5L specification39 material identifications were used to indicate material grades, also for equivalent material grades.
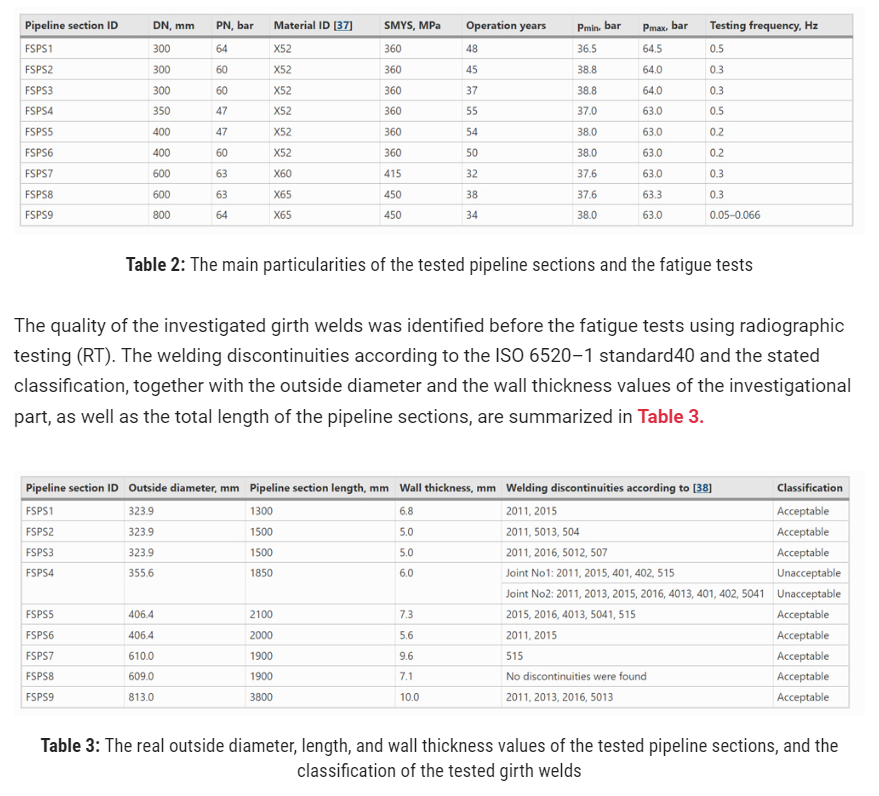
The radiographic testing (RT) were performed by a third party. The assessment was carried out according to the operator’s (FGSZ Ltd., the owner and operator of the Hungarian high-pressure natural gas pipeline system) internal rules based on API 110441, EN 14,16342, BS 451543, and EN ISO 581744. The piece of pipe cut from the gas transporting pipeline system from which the FSPS4 pipeline section was made contained two girth welds (joint No1 and joint No2); therefore, they were tested at the same time.
The RT was repeated after the fatigue tests. The results showed no changes in any of the cases, so the relevant data (right two columns) in Table 3 are valid for both RT.
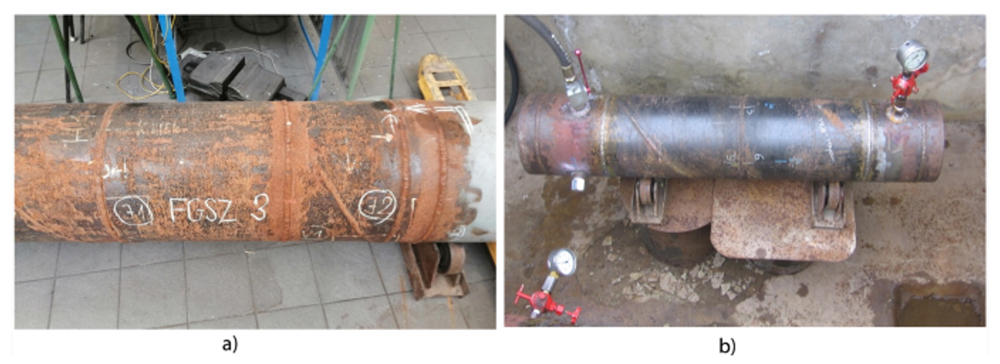
Figure 6 shows the cut pipe with the two tested girth welds before the formation of the pipeline section FSPS4 and a prepared pipeline section FSPS3 before the fatigue test.
2.3 Implementation of the tests and main testing parameters
The tests of a pipeline section consist of two parts. In the fatigue part, the pipe sections are up-loaded, 100,000 cycle repetitions are performed, and this section is completed with the unloading. The fatigue phase lasts several days, and the test is performed without stopping. In the bursting phase, the pipeline section is loaded to failure with a single up-loading; the duration of this phase is a few minutes.
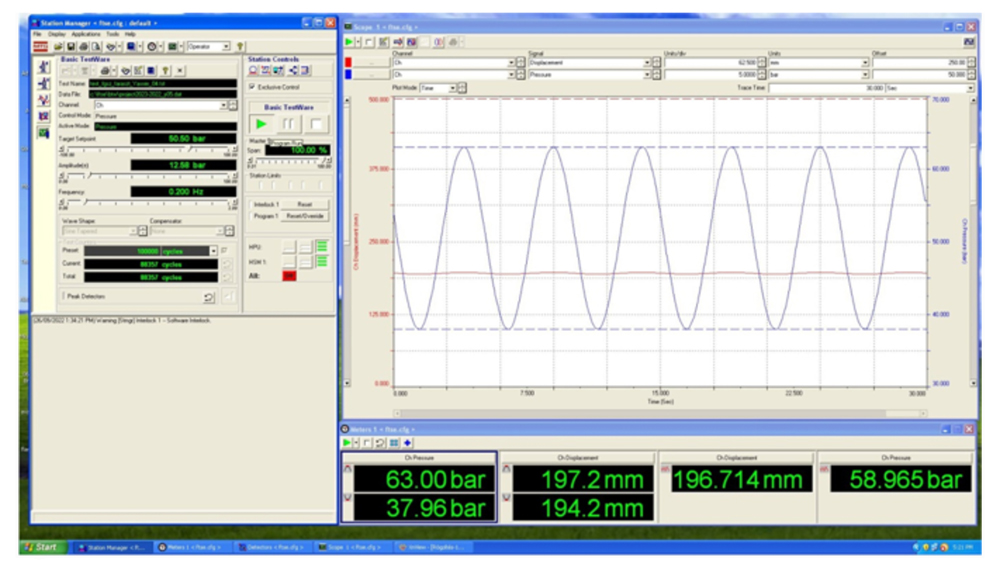
Computer-controlled MTS-type electro-hydraulic testing system with a maximal applicable pressure of 100 bar (Figures 2 and 4) was used for executing the fatigue tests. The testing frequency values were 0.2-0.5 for FSPSi (i = 1 … 8) and 0.05-0.066 for FSPS9 pipeline section (Table 2), depending on the volume of the investigated pipe section; the programmed load was in all cases a sinusoidal type (Figure 7). The planned number of cycles for the fatigue tests was 100,000 cycles.
An own developed, similarly computer-controlled testing system with a maximal applicable pressure of 700 bar (Figures 3 and 4) was applied for the burst tests. Both the internal pressure and the volume expansion values were registered during the burst tests per seconds.
The applied testing media during both the fatigue and the burst tests was water and the testing temperature was 20-25° C.
3 Results and Discussion
The number of cycles of the fatigue tests was 100,000 cycles except for one pipeline section (FSPS9). One of the welded fittings (DN25) of pipeline section FSPS9 started to leak; therefore, the fatigue test was stopped (94.050 cycles), the fitting was re-welded, but the fatigue test was not continued. During the fatigue tests, neither the surfaces nor the girth welds of the pipeline sections were damaged. Repeated RT of the girth welds showed no changes (Table 3).
The following diagrams and figures demonstrate the results of the full-scale burst tests, and table summarizes the full-scale test results.
Figure 8 illustrates the internal pressure vs. burst test time diagrams of the investigated DN300 pipeline sections (FSPSi, i = 1, 2, 3), where the arrows indicate the burst points. The average pressure growth rate values in the first stage, between 0 bar and approximately 60 bar of the tests are 6.0 bar/s, 5.3 bar/s, and 8.2 bar/s, respectively. All three average pressure growth rate values can be evaluated as quasi-static values, and the greatest value cannot considered as dynamic impact.
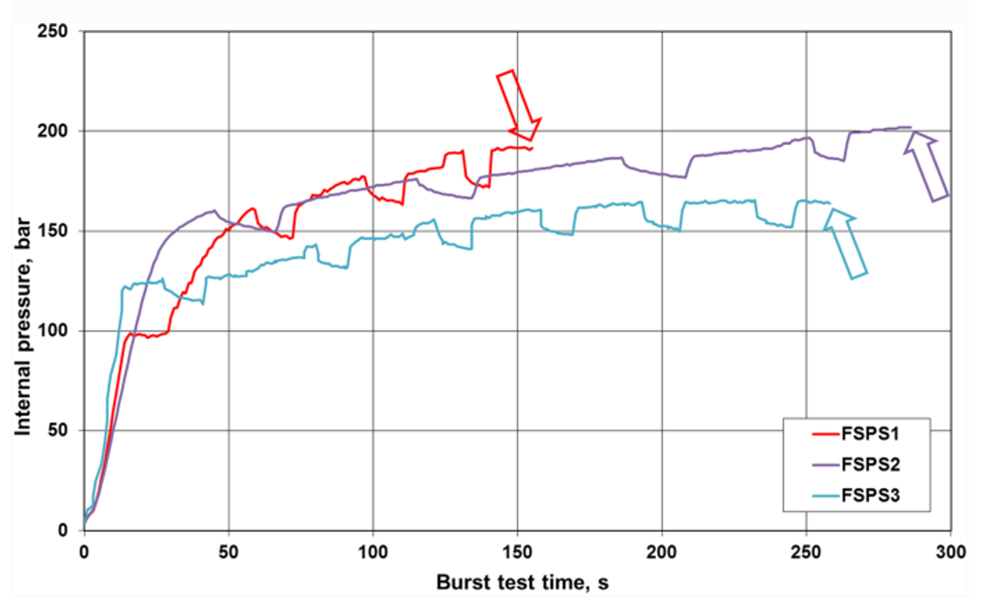
Other characteristics of the diagrams are the same; the tines-like changes of the diagrams demonstrate the volume expansions of the sections. During the tines-like changes (Figure 8) and in similar figures further on, the system draws water from the water supply network to make up for the increase in volume due to the elastic–plastic deformation of the investigated pipeline section.
Figure 9 shows the volume expansion of the FSPSi (i = 1, 2, 3) pipe sections during their burst tests. The stairs of the curves are important characteristics of the tests and the testing system; the horizontal stages belong to the water intakes from the external water system to the testing system, which is the result of the elastic-plastic deformation (expansion) due to an increase in internal pressure.
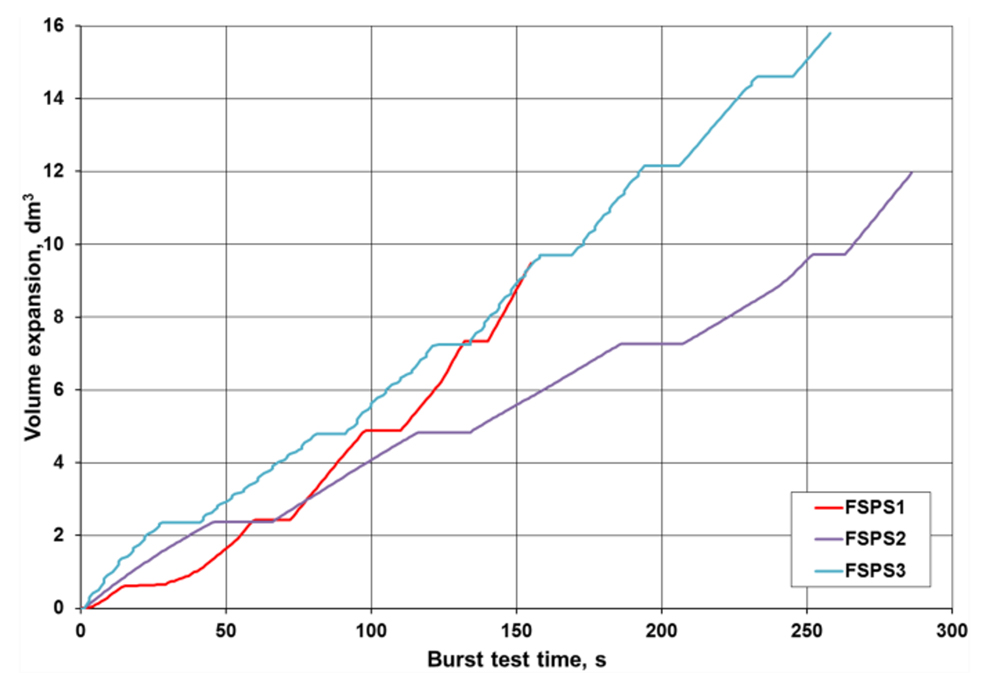
Figure 10 shows the FSPS2 pipeline section during and after its burst tests, which clearly demonstrates that the failure did not take place in the girth weld located in the middle of the section. The load-bearing capacity of the assembly girth weld was lower than that of the tested girth weld.
The FSPS3 pipeline section during and after its burst tests, which clearly demonstrates that the failure take place in the girth weld located in the middle of the section (Figure 10).
Figures 10 and 11 adequately illustrate the volume expansions and the swelling of both pipe sections during the burst tests.
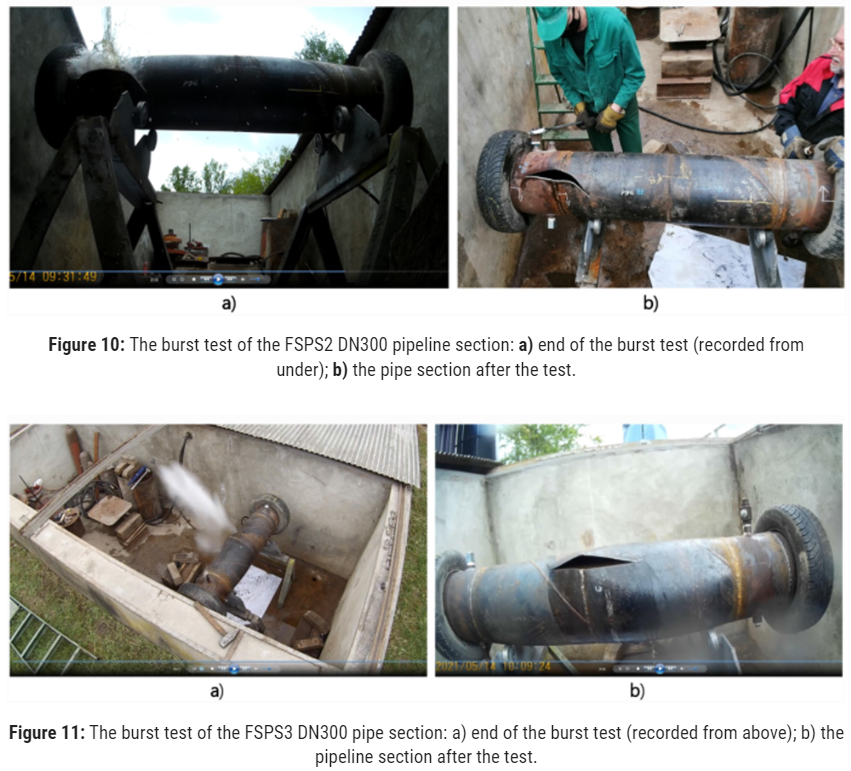
Figure 12 illustrates the internal pressure vs. burst test time diagrams of the investigated DN350 pipeline section (FSPS4), containing two test girth welds. For both girth welds containing unacceptable welding discontinuities, a slight leakage was detected, which resulted in a pressure drop and water intake from the water supply network.
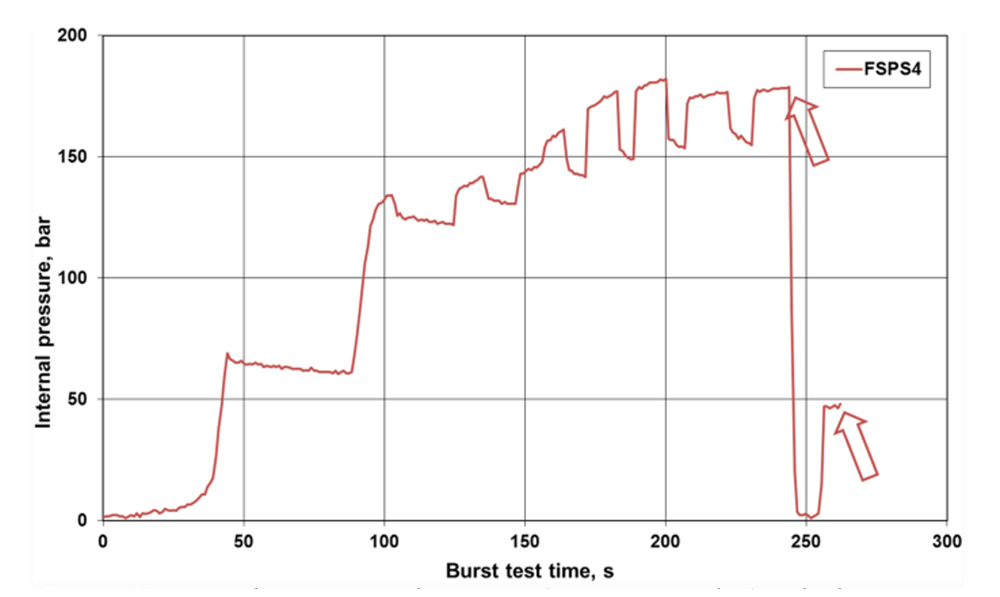
The leakage continued during the water intake, water was drawn, and as the pressure increased, one of the seams continued to leak, but the other one ruptured. Due to the fact that both girth welds were damaged during the burst test, the nature of the diagram is different from the previous cases.
The two arrows this time belong to the beginning of the two damages. The pressure growth rate value was quasi-static in this case, too.
Figure 13 shows the volume expansion of the FSPS4 pipe section during its burst test; furthermore, The pipe section after the burst test, in which water is still trickling from one of the damaged girth welds (Figure 14). It is also possible to observe the different plastic deformation characteristics of the pipe section areas between the individual girth welds.
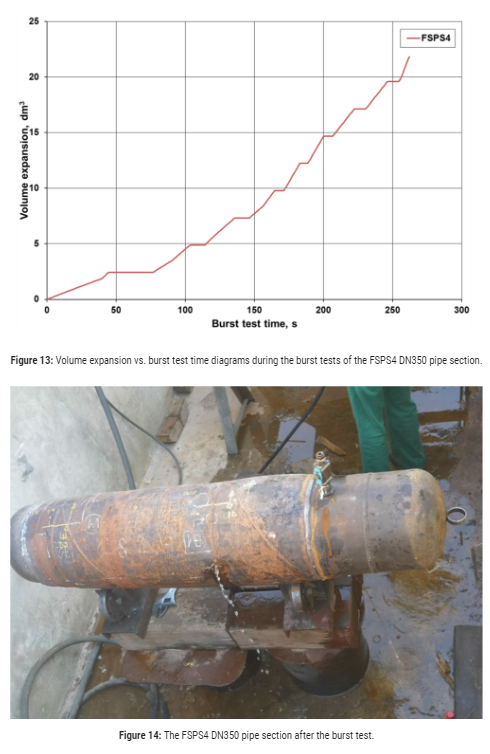
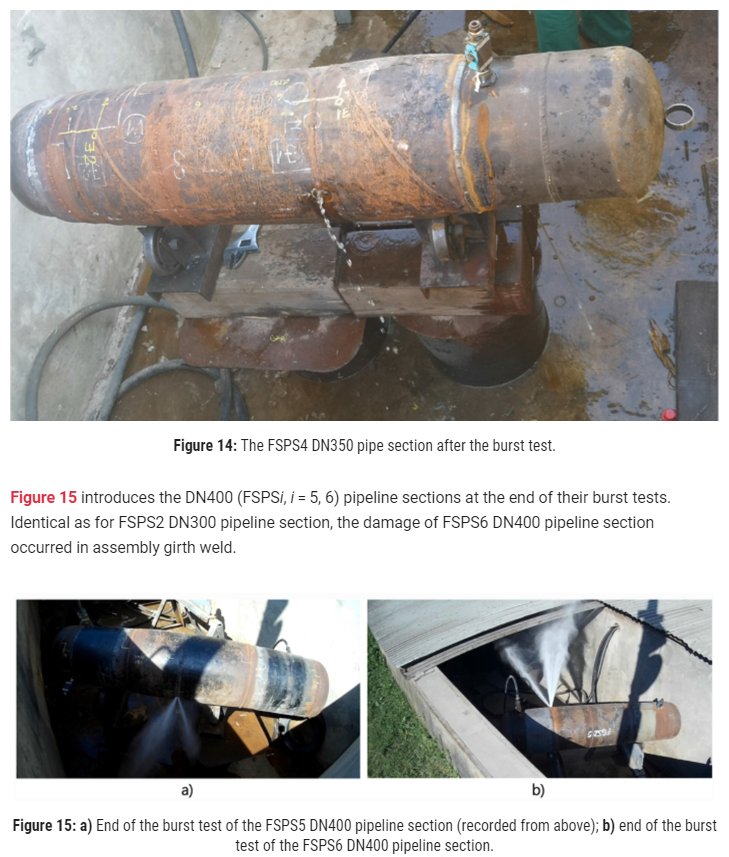
Figure 16 illustrates the internal pressure vs. burst test time diagrams of the investigated DN600 pipeline sections (FSPSi, i = 7, 8), where the arrows indicate the burst points in these cases, too. The average pressure growth rate values in the first stage are 1.8 bar/s and 1.9 bar/s, respectively; hence, these values can be evaluated as quasi-static values, and those cannot consider as dynamic impact.
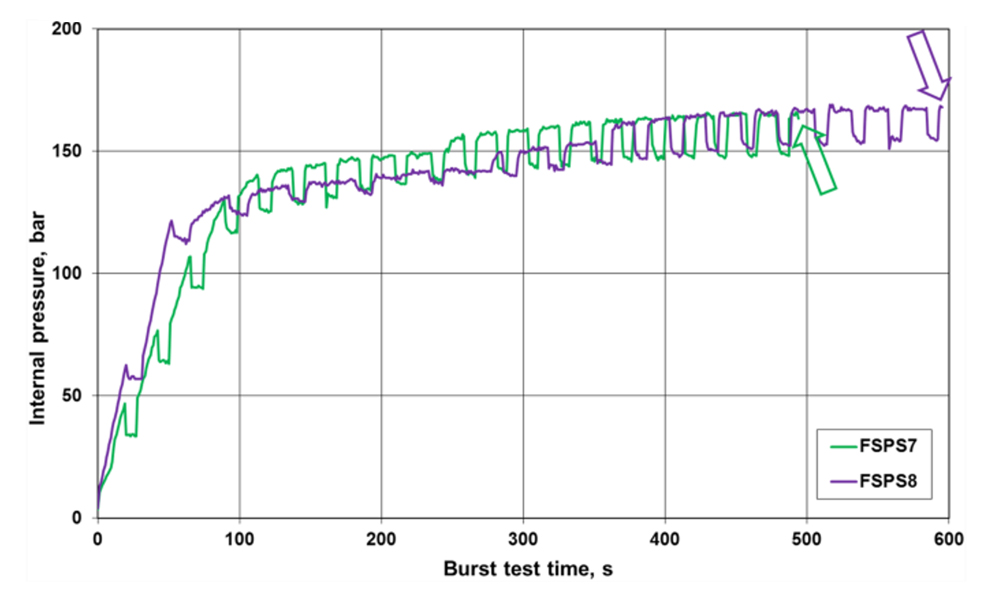
The characteristics of the diagrams are the same; the several tines-like changes of the diagrams demonstrate the large-scale volume expansions of the sections.
Figure 17 shows the volume expansion of the FSPSi (i = 7, 8) pipe sections during their burst tests. The volume expansion values can be compared with the relevant values of the DN300 (FSPSi, i = 1, 2, 3) and DN350 (FSPS4) pipeline sections (see Figures 9 and 13, respectively).
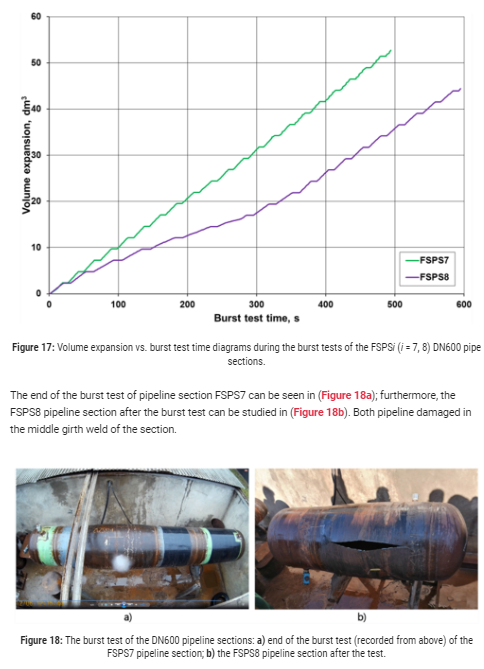
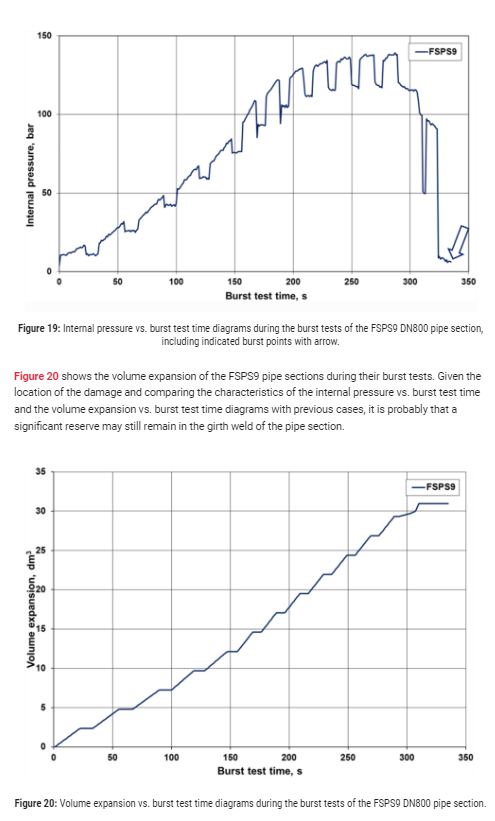
Figure 19 illustrates the internal pressure vs. burst test time diagram of the investigated DN800 pipeline section (FSPS9). Forasmuch as the damage has happened in the welded fitting, the arrow indicates the leakage point in this case.
The damage process started with a slight leakage accompanied by a pressure drop. During this time, the system drew water from the water supply network two times, the leakage continued and the rupture occurred.
The pipeline section FSPS9 during its fatigue test can be seen in Figure 21a, and the location of the damage after the penetrant testing (PT) is seen in Figure 21b.
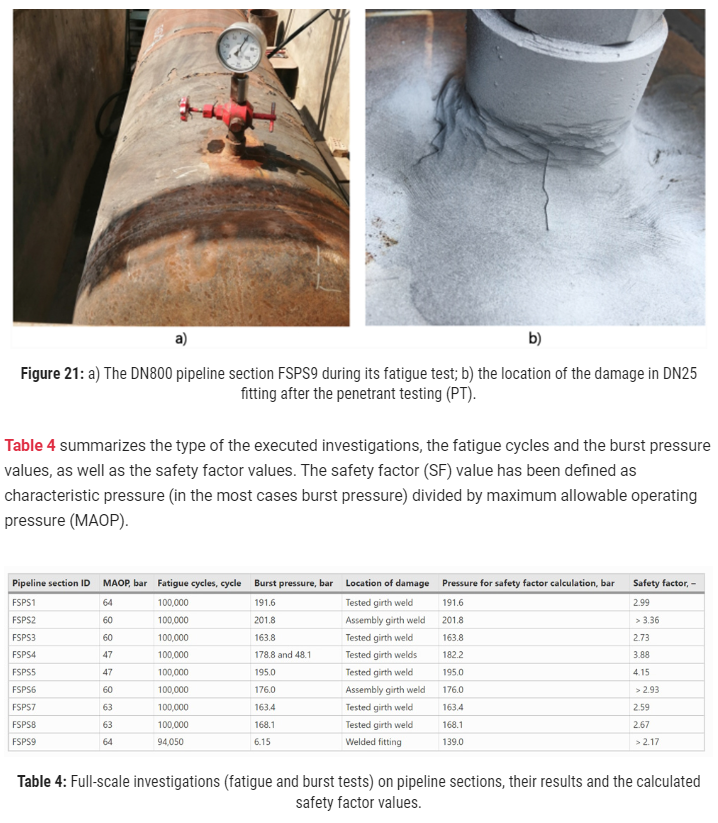
In cases where the damage did not occur clearly in the girth weld in the middle or in the assembly girth weld (FSPS4 and FSPS9), the pressure used to calculate the safety factor was higher than the measured burst pressure. In cases where the girth weld in the middle is not damaged, the calculated safety factor can be interpreted as a minimum safety factor value (FSPS2, FSPS6 and FSPS9).
Considering that all investigated pipeline sections (consequently girth welds) were cut from pipelines that have been operated for several decades (Table 2), the MAOP values are data from the operator. Unfortunately, the damage cases in Hungary prove (Table 1 and Figure 1) that fractures also occur in girth welds. In the tests presented in this article, with one exception, the girth welds were damaged. The applied safety factor expresses that even in those girth welds whose quality is unacceptable, there is a margin of safety. Real girth welds are also subject to additional stresses (e.g., bending stresses), which are not yet modelled in these experiments. Finally, the safety factor also indirectly indicates how low the quality of the girth welds damaged during operation was.
4 Conclusions
Based on the executed full-scale tests and their results, furthermore, the damages of the girth welds, the following main conclusions can be drawn.
Both similarities and differences can be observed in the behavior of experimental full-scale pipe sections containing girth welds. Both the similarities and the differences depend on the geometrical dimensions of the pipe sections (outside diameter, wall thickness) and the strength category of the material of the pipes (X52, X60, X65). The detected material discontinuities did not cause significant differences of the behavior of the pipe sections during the full-scale tests.
The burst pressure value divided by the maximum allowable operating pressure value can be interpreted as safety factor. The safety factor demonstrates the reserves of the girth welds, after a long-term operation. Furthermore, the safety factor is appropriate for the ranking of the dangerousness of the girth weld discontinuities, in the event that a sufficient number of test results are available.
The results of the girth weld full-scale tests are in harmony with the introduced assessment methods of girth welds of steel pipelines45.
Data and databases, pre-eminently the experimental data, have a determinant role in the integrity assessment and integrity management of different structural elements, structures and technical systems, as pipelines and pipeline systems46, 47. With the help of these data and databases, and using the experimental data with critical approach:
- integrity management systems can be established48,49,50,51
- integrity assessment and residual life-time calculations can be achieved52
- guidelines or rules can be established53, 54
- survival models can be developed55
- and last but not least, management decisions can be made56, 57.
Full-scale fatigue and burst test are the best ways of assessing the crack propagation resistance of a natural gas pipeline, especially in cases of the girth welds. This statement is true despite the fact that both the full-scale tests and the fatigue and burst tests are time-consuming and expensive.
Our full-scale test program on pipeline sections will be continued. On the one hand, both different types of the girth welds and girth welds with internal pressure and superimposed external load will be investigated. On the other hand, according to Hungary’s National Hydrogen Strategy58, the effect of mixing of hydrogen to natural gas in the gas network on the girth welds will be investigated, too.
Editor’s note:
Editor’s note: This article originally appeared on Springer Link at https://link.springer.com/article/10.1007/s40194-023-01501-x, and appears in P&GJ under a Creative Commons license https://creativecommons.org/licenses/by/4.0/
An earlier version of this article appeared in Welding in the World, Vol. 67, in May 2023.

Comments